
This post is by Prof. Dr. Wil van der Aalst, Chairholder in the Process And Data Science group at RWTH Aachen University. Contact him via email for further inquiries.
Conformance checking aims to uncover differences between a process model and an event log. Initially, process mining focused on discovering process models from event data, but in recent years, the use and importance of conformance checking increased. Many conformance checking techniques and measures have been proposed. Typically, these take into account the frequencies of traces in the event log, but do not consider the probabilities of these traces in the model. This asymmetry leads to various complications. A novel way to approach this, is to assume probabilities and subsequently use the Earth Movers’ Distance (EMD) between stochastic languages representing models and event logs.
The Earth Movers’ Distance (EMD) provides and simple and intuitive conformance notion. The typical problems related to precision vanish immediately! Moreover, the approach is extensible to other perspectives (including time and resources) and can also be applied to concept drift detection and comparative process mining. This blog post summarizes part of my presentation given on 19-11-2019 in the weekly PADS Seminar Series (slides are attached at the bottom of the page).
What is the problem?
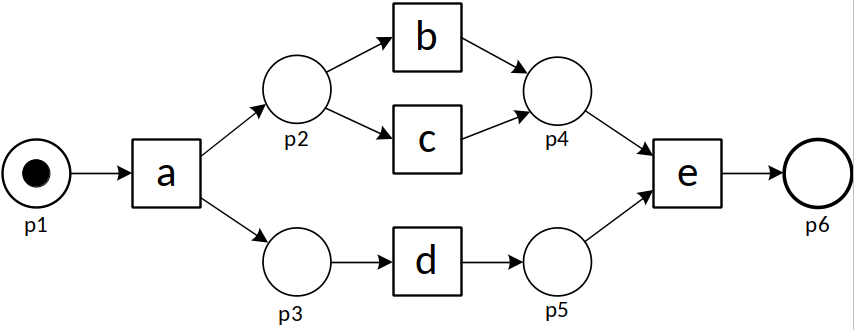
To explain the problem, let us consider the following process model and five event logs (L1 – L5).
| L1 | = [〈a,b,d,e〉490,〈a,d,b,e〉490,〈a,c,d,e〉10,〈a,d,c,e〉10] |
| L2 | = [〈a,b,d,e〉245,〈a,d,b,e〉245,〈a,c,d,e〉5,〈a,d,c,e〉5,〈a,b,e〉500] |
| L3 | = [〈a,b,d,e〉489,〈a,d,b,e〉489,〈a,c,d,e〉10,〈a,d,c,e〉10,〈a,b,e〉2] |
| L4 | = [〈a,b,d,e〉500,〈a,d,b,e〉500] |
| L5 | = [〈a,c,d,e〉500,〈a,d,c,e〉500] |
Each trace in L1 matches a trace of the model and vice versa. Hence, all existing recall and precision measures tend to give a high score (i.e., good conformance). Half of the traces in L2 do not fit the model (〈a,b,e〉is impossible according to the model, but occurs 500 times). Hence, all existing recall measures will report a low recall score for L2. However, these measures will report a high score for recall when L3 is considered. The reason is that in L3, 99.8% of the traces are fitting (〈a,b,e〉occurs only twice). Existing recall measures tend to give high scores when L4 and L5 are considered since the model can reproduce all traces observed. However, both L4 and L5 are only covering two of the four traces allowed by the process model. Hence, existing precision measures tend to give a lower score for L4 and L5. Moreover, due to symmetry, there is no reason to consider L4 and L5 to be different from a precision point of view.
The above analysis of existing recall measures shows that frequencies matter. L2 and L3 have the same sets of traces, but 50% of the traces of L2 are fitting and 99.8% of the traces of L3 are fitting. Hence, most recall measures will consider L3 to conform much better than L2. The logical counterpart of frequencies in event logs are routing probabilities in process models. However, almost all existing measures ignore such routing probabilities. This leads to an asymmetry.
Therefore, we argue that also probabilities matter.
Probabilities matter!
We start by adding probabilities to the process model introduced before.
The numbers attached to transitions can be interpreted as weights. The probability of trace〈a,d,b,e〉is 0.5×0.98 = 0.49, the probability of trace〈a,d,c,e〉is 0.5 ×0.02 = 0.01, etc. Hence, the model describes a so-called stochastic language:
| M | = [〈a,b,d,e〉0.49,〈a,d,b,e〉0.49,〈a,c,d,e〉0.01,〈a,d,c,e〉0.01] |
Similarly, we can convert trace frequencies into probabilities:
| L1 | = [〈a,b,d,e〉0.49,〈a,d,b,e〉0.49,〈a,c,d,e〉0.01,〈a,d,c,e〉0.01] |
| L2 | = [〈a,b,d,e〉0.245,〈a,d,b,e〉0.245,〈a,c,d,e〉0.005,〈a,d,c,e〉0.005,〈a,b,e〉0.5] |
| L3 | = [〈a,b,d,e〉0.489,〈a,d,b,e〉0.489,〈a,c,d,e〉0.01,〈a,d,c,e〉0.01,〈a,b,e〉0.002] |
| L4 | = [〈a,b,d,e〉0.5,〈a,d,b,e〉0.5] |
| L5 | = [〈a,c,d,e〉0.5,〈a,d,c,e〉0.5] |
By converting event logs and process models to stochastic languages, conformance is reduced to the problem of comparing stochastic languages.
Consider model M and the five event logs L1, L2, L3, L4, and L5. Obviously, L3 is closer to M than L2. Similarly, L4 is closer to M than L5. We propose to use the so-called Earth Mover’s Distance (EMD) to compare stochastic languages. If the probabilities of traces are considered as piles of sand, then EMD is the minimum cost of moving the sand from one distribution to another. EMD requires a distance notion. For our Earth Movers’ Stochastic Conformance notion, we provided several distance notions, e.g., the normalized edit distance between two traces.
Earth Movers’ Stochastic Conformance
If we assume the normalized edit distance between traces, then the EMD distance is a number between 0 (identical, i.e., fully conforming) and 1 (worst possible conformance). For our model M and logs L1,L2, …, L5 we find the following distances: 0 for L1, 0.125 for L2, 0.0005 for L3, 0.005 for L4, and 0.245 for L5. Note that distance is the inverse of similarity, i.e., for model M and logs L1,L2, …, L5 we find the following Earth Movers’ Stochastic Conformance similarity measures: 1 for L1, 0.875 for L2, 0.9995 for L3, 0.995 for L4, and 0.755 for L5. Hence, given M, L1 has the best conformance, L3 is much better than L2, and L4 is much better than L5. This matches our intuition, e.g., L5 does not have any executions of b although, according to the model, b should be executed for 98% of cases. Note that there is just one conformance measure and not two separate measures for recall and precision. This makes sense considering that increasing the probability of one trace should coincide with lowering the probabilities of other traces.
Just the starting point!
The approach is very promising and has been implemented in ProM. This was mostly done by Sander Leemans from QUT. Next, to these conformance measures, we also defined various types of diagnostics to identify conformance problems in both log and model. In addition, challenges related to infinite loops, duplicate activities, and silent activities have been addressed. Recently, also Tobias Brockhoff joined the team and is focusing on using the EMD notion to concept drift, i.e., detecting when and how process change. Moreover, he also extended the above techniques with time. This allows us to see how performance is changing. These techniques are being applied in the Internet of Production (IoP) Cluster of Excellence at RWTH. The work of Tobias can be used to find and diagnose performance problems and uncover changes in routing and delays in production systems.
Learn More?
Check out the slides of the PADS Seminar Series.
- S.J.J. Leemans, A.F. Syring, and W.M.P. van der Aalst. Earth Movers’ Stochastic Conformance Checking. In T.T. Hildebrandt, B.F. van Dongen, M. Röglinger, and J. Mendling, editors, Business Process Management Forum (BPM Forum 2019), volume 360 of Lecture Notes in Business Information Processing, pages 127-143. Springer-Verlag, Berlin, 2019.
- W.M.P. van der Aalst, A. Adriansyah, and B. van Dongen. Replaying History on Process Models for Conformance Checking and Performance Analysis. WIREs Data Mining and Knowledge Discovery, 2(2):182-192, 2012.