
This post is by Marco Pegoraro, Scientific Assistant in the Process And Data Science group at RWTH Aachen University. Contact him via email for further inquiries.
In previous posts on this blog, we talked about uncertainty in process mining, both in the context of conformance checking and process discovery. In an uncertain process trace, the attributes of an event are not recorded as a precise value but as a range or a set of alternatives.
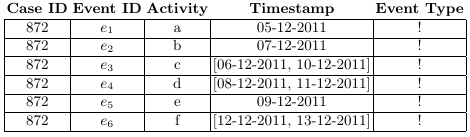
If we consider the case of timestamps represented as ranges, the total order usually present among events in a trace is lost; time relationships exist in a partial order instead, where the order between events that have overlapping timestamps is undefined. The directed acyclic graph that graphically represents this partial order is called a behavior graph.
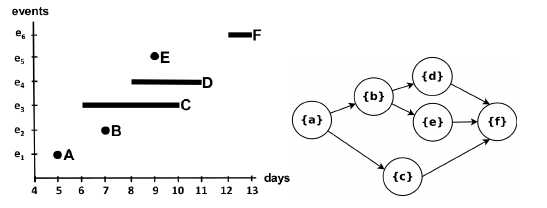
A straightforward way to obtain a behavior graph is to check all pairs of events, connecting the ones that have a well-defined time relationship, then perform a transitive reduction to remove unnecessary edges. This runs in a cubic time with respect to the number of events. In the paper “Efficient Construction of Behavior Graphs for Uncertain Event Data” (Pegoraro, Uysal, van der Aalst) we present a method to build behavior graphs in quadratic time, leading to a more efficient analysis of uncertain data in process mining.