
Archive for March, 2025
Developing Tooling for Models-in-the-Middle
This post has been authored by Leah Tacke genannt Unterberg.
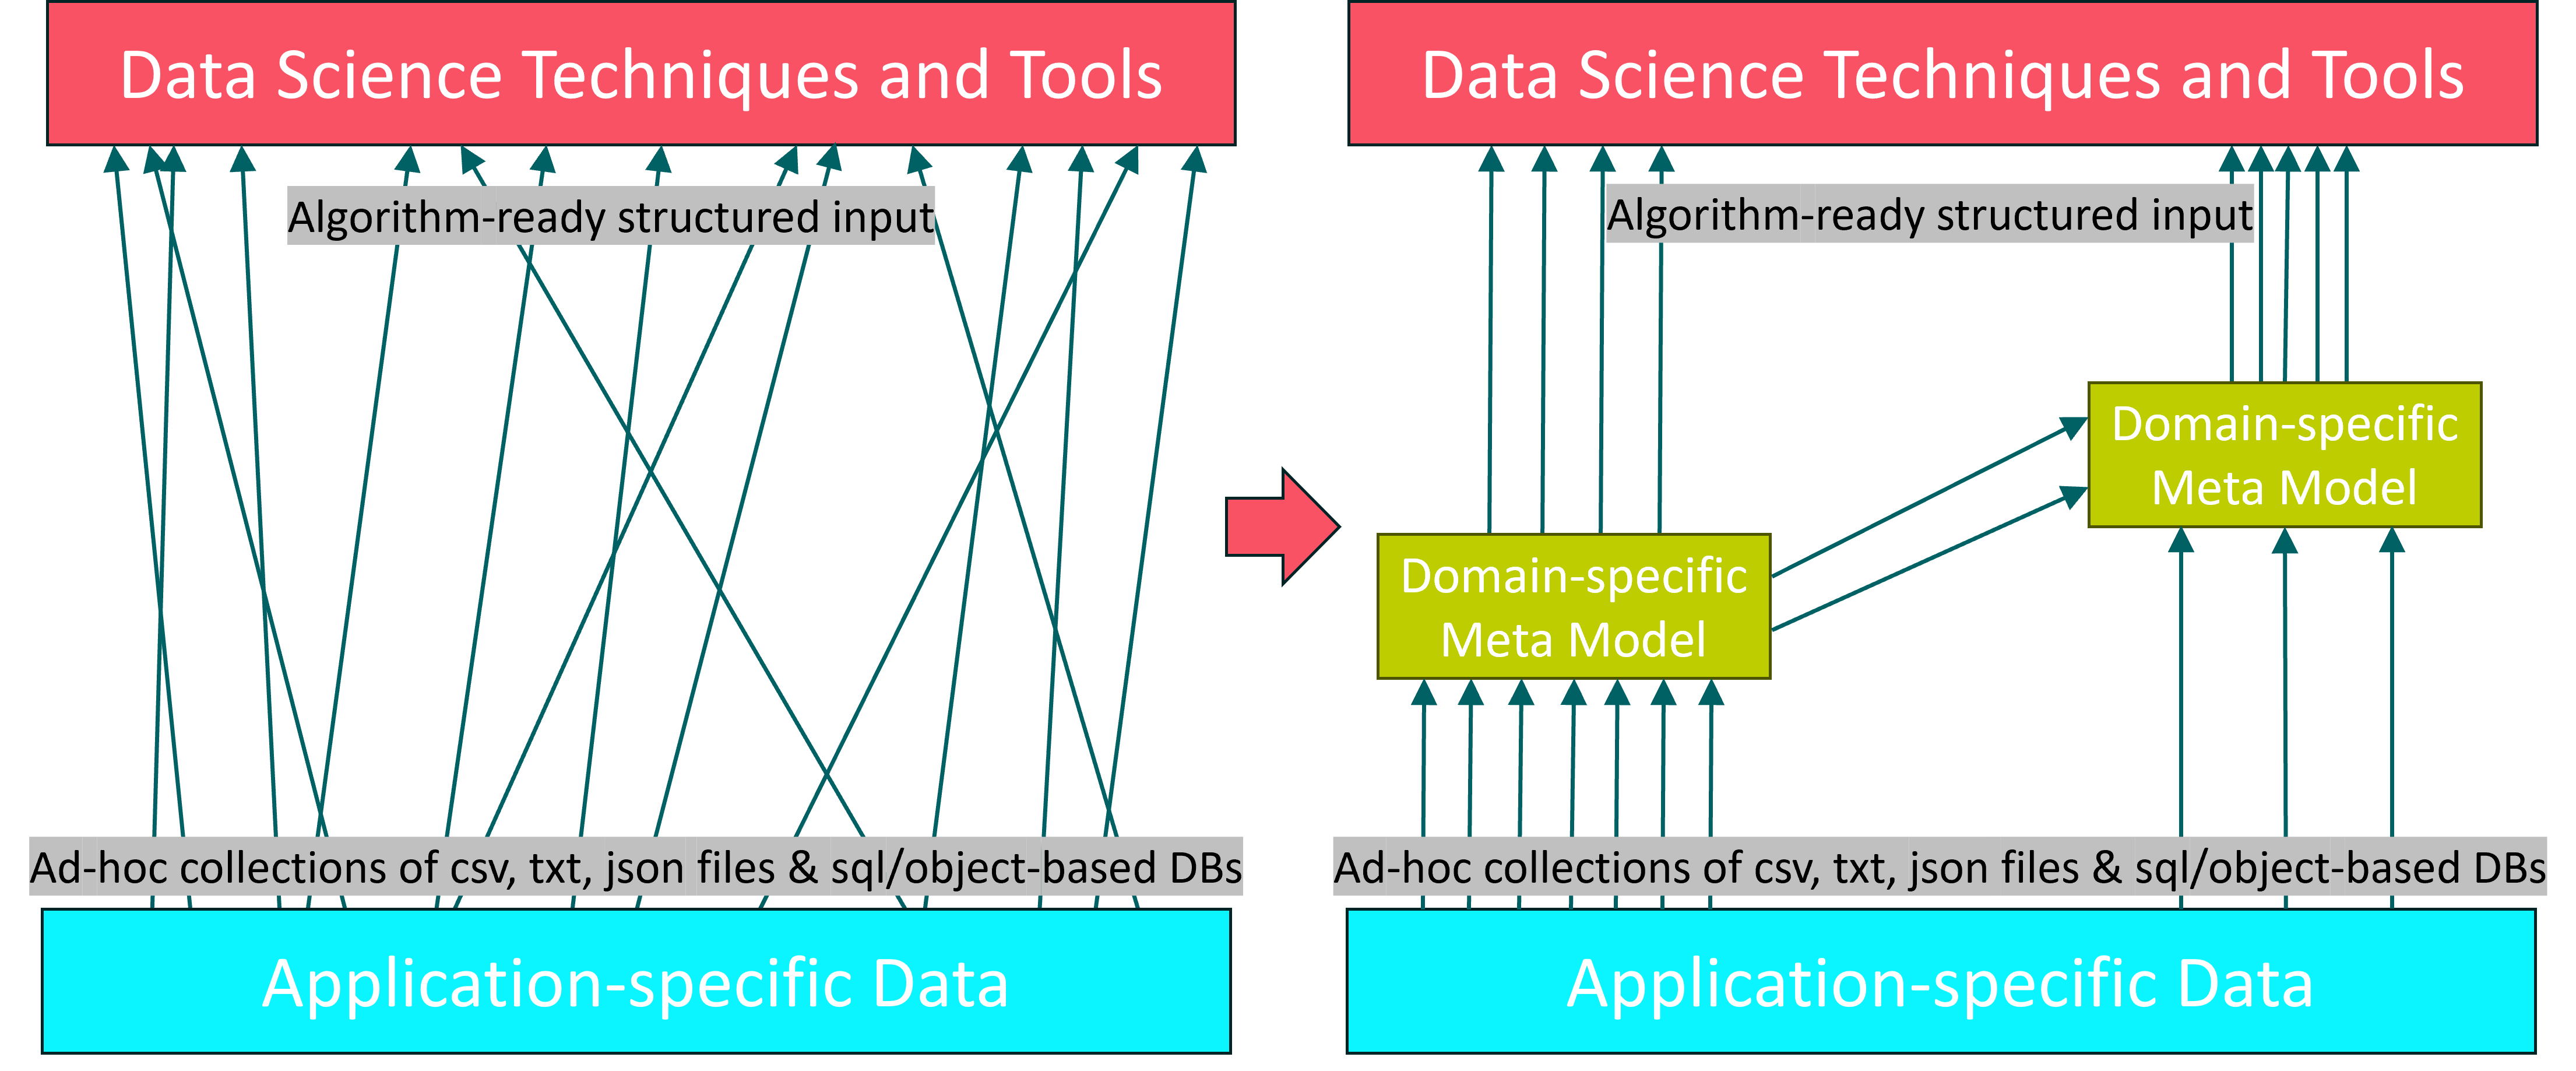
In the Cluster of Excellence “Internet of Production” (IoP) of RWTH Aachen University, the concept of Models-in-the-Middle (MitM) has been proposed to avoid the recurring development of custom data pipelines from source to analytics.
The project and its predecessor have been running for over ten years, with over 100 financed researcher positions from over 30 institutes/independent organizational units, each with their own goals. Over time, the isolated development of “data infrastructures” – which has historically not been a research activity in the field of mechanical engineering – has led to the expenditure of much duplicated effort.
As data is the basis for basically all the promises of the project and any shiny AI application, every researcher needs to have some kind of pipeline from data as it is produced by sensors, machines, etc., to algorithms running on their laptop, their institute’s server, or the cloud. As coordination on that front has not been part of the project’s realization, barely any reusable artifacts have been created, shared, and curated within the IoP. This includes IoP-accessible data sets themselves, but that is another story…
To be able to perform data-based research more efficiently, shared data models that can serve as the basis for implementation interfaces across a whole domain may be quite useful. In the domain of process mining, this has been shown to be quite the enabler. See XES, ProM, and now the OCED Model.
Essentially, as any standardization argument goes, an agreed-upon model and representation drives collaboration, reuse/adaptation of existing tools, and thus, broadens the horizon for newcomers into the project.
The following graphic exemplifies this situation.
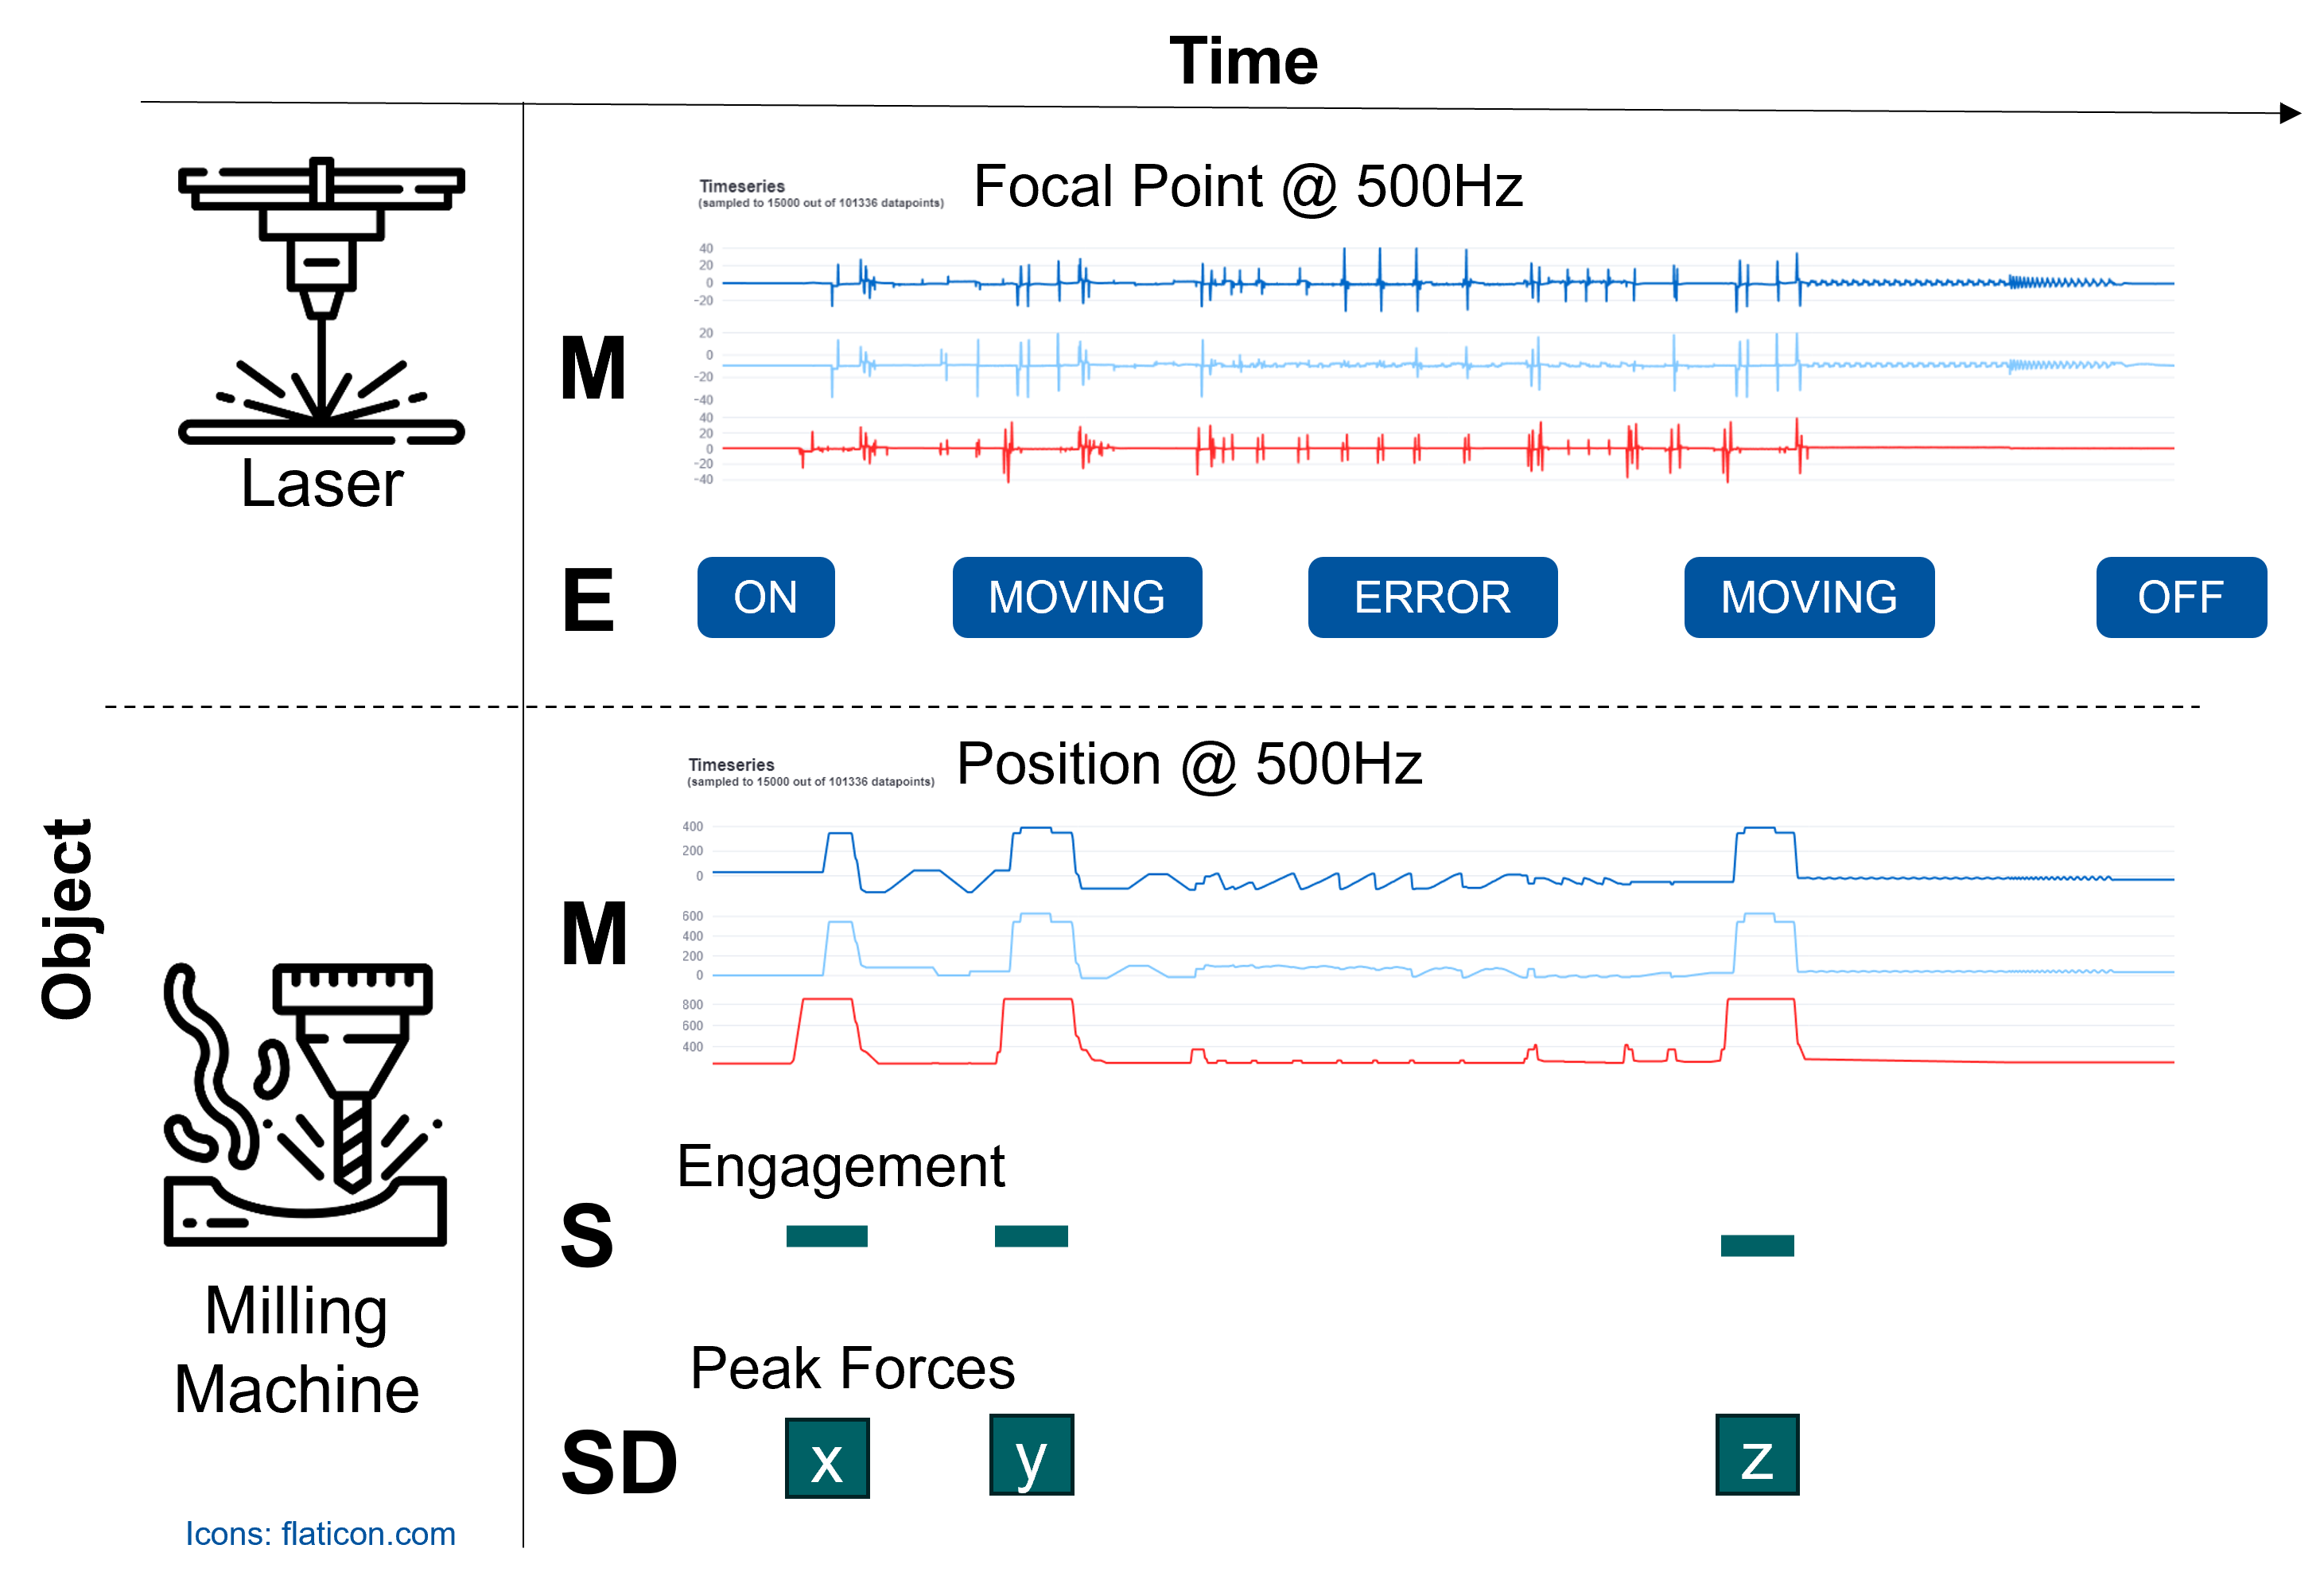
As the most prominent type of data in the IoP is that coming from sensors and machines during operation, we have introduced a specialized model for it.
It focuses on the aspect of time and specifically aims to support rich time series analysis via the inclusion of time intervals/segments which play a major role in the data pre-processing in this domain, as data is often continuously recorded and needs to be cut into individual operations, regimes, etc.
Consider the following model and schematic example of the proposed data model for Measurement and Event Data (MAED).

To start, we developed a tool for finding, mapping, and exporting, MAED-conforming data from relational databases – which typically lie at the heart of a research institute that documents its experiments.
Well, in the best case that is. It can also lie on a thumb drive of a researcher who’s no longer employed there.
Projects like Apache Hive extend the reach of SQL queries to JSON and object-oriented data stores, so assuming some tabular interface is not too far-fetched for most use-cases.
MAED (MitM) Exporter
Enter, the MAED Exporter WebApp. It can connect to most relevant DBMS (via sqlachemy and generate MAED data sets in the proposed text-based representation.
The project is available here and hosted https://maed-exporter.cluster.iop.rwth-aachen.de/.

The user can iteratively explore, transform, and map the tables of the connected DB (or uploaded sqlite file).
Finally, the resulting virtual table definitions, mappings, and queried and transformed data sets can be exported.
Once the mapping work is done and saved as a preset, data sets can be exported on demand, and, in future extensions, be queried directly by visualization tooling.
Generalization
When developing the exporter, we envisioned to support not just this specific data model in its current iteration, but rather to make the implementation configurable to any data model expressed in a JSON configuration file.
The result is that the exporter app itself lives on the level “connecting relational data to meta-modeled concepts” instead of “connecting relational data to MAED”. Hence, it can be considered a MitM Exporter, not just MAED.
The next logical step after getting data in the specified representation is of course to display it.
MitM Superset
To make this tooling robust, scalable, reusable, and extensible to the extent that single-person research projects typically are not, we decided to customize Apache Superset, an open-source “dashboarding” tool.
While the upfront effort required is immense compared to starting from scratch, there are great benefits from adapting software that has 1200 contributors. For one, the project is developed to a high standard with regard to security and scalability. Further, there are some features that make it very extensible, e.g., the ability to create new visualizations entirely in the frontend by providing it as a plugin that reuses code from the superset core.
To connect MitM data to such a tool, we first developed a canonical relational representation of the “family of MitMs” that can be described like MAED.
Based on this, we can create interactive dashboards that can give a comprehensive overview over specific data sets.
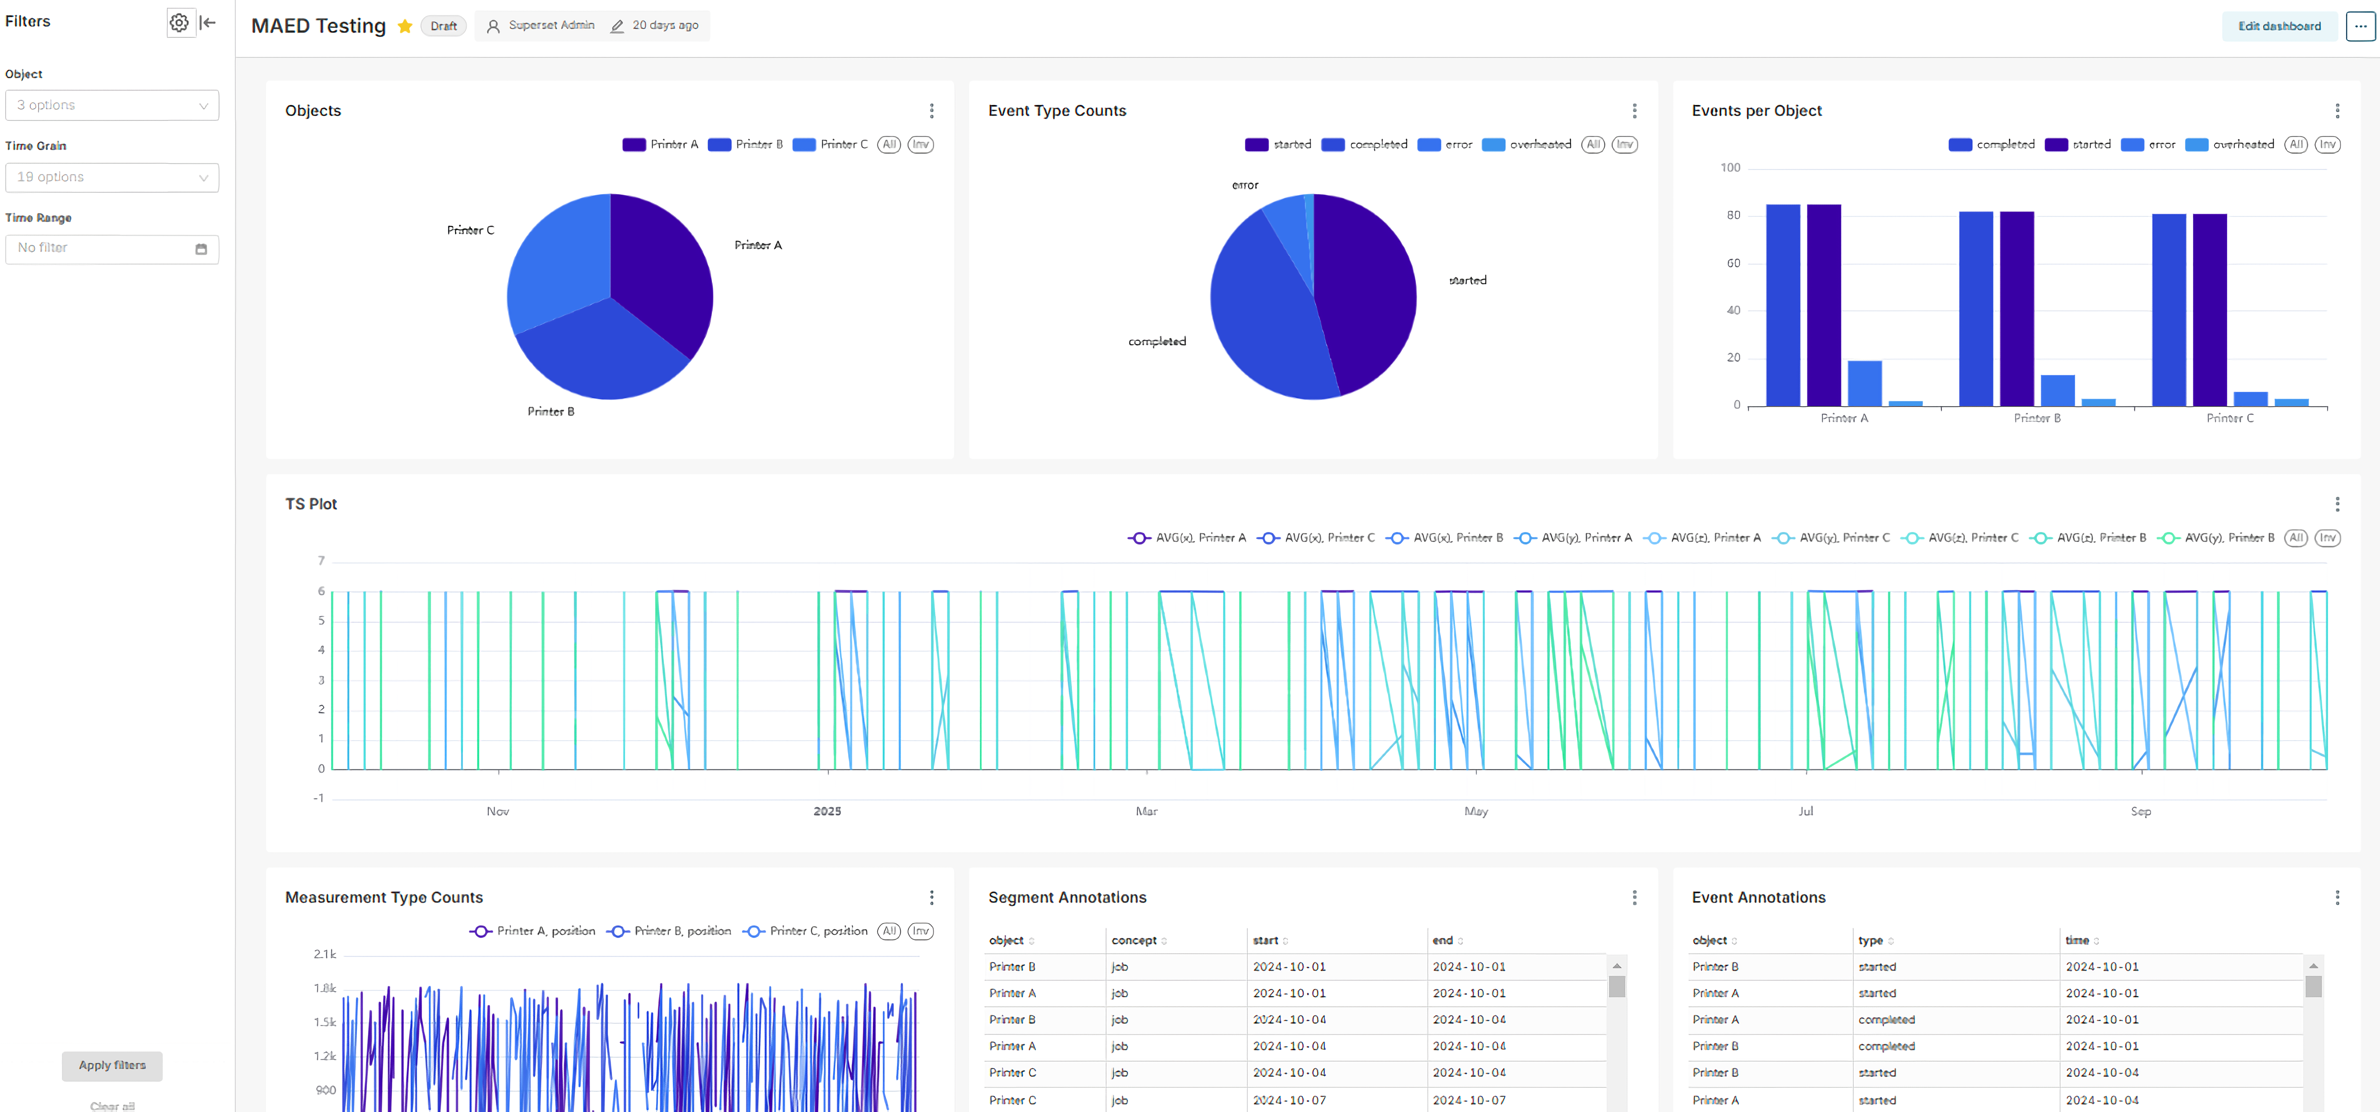
In the beginning, the process of importing the data into a Superset instance would be manual, but we have started to implement a Superset fork that has “native MitM support”, i.e., that knows about the concept of MitMDataset in addition to the usual Database, Table, Chart and Dashboard.
Our fork includes an architectural extension to the regular Superset docker-compose network: independent MitM services can be added to the network, and their APIs be reached from the Superset front- and backend.
You can follow the development here.
The first hosted instance should be available in mid-April.
