
This post has been authored by Ali Norouzifar.
Detecting and Explaining Process Variability Across Performance Dimensions
In the dynamic landscape of business processes, understanding variability is pivotal for organizations aiming to optimize their workflows and respond to inefficiencies. While much of the focus in process mining has been on detecting changes over time [1], such as concept drift, there is a less-explored yet equally critical dimension to consider: variability across performance metrics like case durations, risk scores, and other indicators relevant to business goals.
In this blog post, we summarize the process variant identification framework presented in [2], outlining the advancements made and potential future directions. The research introduces a novel framework that detects change points across performance metrics using a sliding window technique combined with the earth mover’s distance to evaluate significant control-flow changes. While the framework excels at identifying where variability occurs, the task of explaining these detected control-flow changes across performance dimensions remains an open challenge. This ongoing work, currently under review, aims to bridge that gap. The framework not only pinpoints variability but also provides actionable insights into the reasons and mechanisms behind process changes, empowering organizations to make informed, data-driven decisions.
A Motivating Example
To demonstrate how our algorithm works, we use a simple yet illustrative motivating example. In this example, the exact change points are known, allowing us to clearly show how our technique identifies and explains these changes. We encourage you to explore the implemented tool yourself by visiting our GitHub repository (https://github.com/aliNorouzifar/X-PVI). Using Docker, you can pull the image and follow along with this blog post to test the algorithm in action.
Processes are inherently complex, influenced by various dimensions beyond just time. For instance, consider the BPMN model illustrating a synthetic claim-handling process in Figure 1. In this process, the risk score of a case significantly impacts execution behavior. High-risk cases (risk score between 10 and 100) might be terminated early through cancellation after creating an application, whereas low-risk cases (risk score between 0 and 3) may bypass additional checks, creating distinct behavioral patterns. These variations, often hidden when processes are analyzed from a singular perspective like time, can lead to overlooked opportunities for targeted improvements. The event log corresponding to this example consisting of 10000 cases is available online (https://github.com/aliNorouzifar/X-PVI/blob/master/assets/test.xes). We use this event log in the following sections to show the capabilities of our framework.
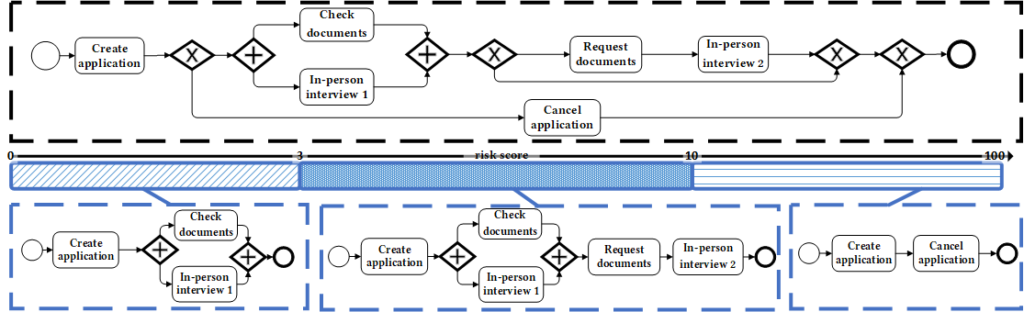
Figure 1: BPMN representation of a claim handling process, highlighting variations based on risk score [1].
The Explainable Process Variant Identification Framework
Our framework combines robust detection of control-flow changes with enhanced explainability, focusing of the performance dimensions. Here is how it works:
Change Point Detection with Earth Mover s Distance:
First, we sort all the cases based on the selected process indicator. Once the cases are sorted, the user specifies the desired number of buckets, ensuring that each bucket contains an equal frequency of cases. Next, we apply a sliding window approach, where the window spans w buckets on both the left and right sides. This sliding window moves across the range of the performance indicator, from the beginning to the end. At each step, we calculate the earth mover s distance to measure the difference between the distributions on the left and right sides of the window. Refer to [3] for a detailed explanation of the earth mover’s distance, its mathematical foundations, and its practical applications. The results are visualized in a heatmap, which highlights specific points where significant process changes occur. In Figure 2, we show a simple example considering 15 buckets and window size of 3.
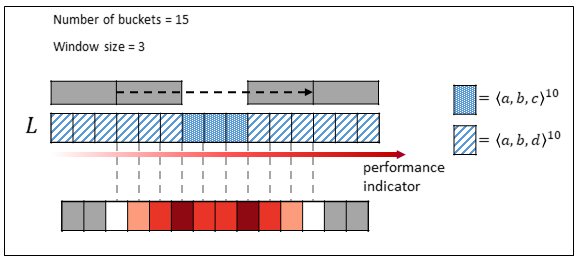
Figure 2: An example of change detection with earth mover s distance.
To determine the change points, we use a user-defined threshold that specifies the significance level for the earth mover s distance, enabling the segmentation process.
In our motivating example (cf. Figure 1), the risk score of the cases is selected as the performance indicator. Considering 100 buckets, each bucket contains 1% of the total cases. The first bucket includes the 1% of cases with the lowest risk scores, while the last bucket contains the 1% of cases with the highest risk scores. In Figure 3, visualizations for different window sizes (2, 5, 10, and 15) are provided. Using a window size of 2 and a significance threshold of 0.15, we can identify three distinct segments. These change points are utilized to define meaningful process segments that align with our initial understanding of the process dynamics. The identified change points are at risk score values of 3.0 and 10.0, accordingly the process is divided into three segments: (1) cases with risk scores between 0 and 3, (2) cases with risk scores between 3 and 10, and (3) cases with risk scores between 10 and 100.

Figure 3: Control flow change detection using the earth mover s distance framework with 100 buckets and different window sizes w∊{2, 5, 10, 15}. The color intensity indicates the magnitude of control-flow changes.
Explainability Extraction:
The explainability extraction framework begins with the feature space generation, where we derive all possible declarative constraints from the set of activities in the event log. This set can potentially be very large. For a detailed explanation of declarative constraints, refer to [4]. Below are some examples of declarative constraints derived from the motivating example event log:
* End(cancel application): cancel application is the last to occur.
* AtLeast1(check documents): check documents occurs at least once.
* Response(create application, cancel application): If create application occurs, then cancel application occurs after create application.
* CoExistence( in-person interview 1, check documents): If in-person interview 1 occurs, check documents occurs as well and vice versa.
For each sliding window, we calculate a specific evaluation metric for each declarative constraint, such as its confidence. For example, if the event create application occurs 100 times within a window, and only 10 of those instances are followed by cancel application, the confidence of the constraint Response(create application, cancel application) in that window is 10/100 or 10%. As the sliding window moves across the range of the process indicator, this evaluation metric is recalculated at each step. This process generates a behavioral signal for each constraint, providing insights into how the behavior evolves across different segments of the process. We do some preprocessing and only include the informative signals, for example, some of the features, may have constant value signals, we remove such signal.
The next step involves clustering the behavioral signals, grouping together signals that exhibit similar changes. This clustering serves as a visual aid, highlighting which signals change in tandem and how these clusters correspond to distinct segments identified during the earth mover s based change point detection step. By analyzing the correlation between the behavioral signals within these clusters and the identified segments, we gain valuable insights into the control-flow characteristics driving process variations as the range of the process indicator shifts from one segment to another.
Considering the window size of 2 and the significant distance threshold of 0.15, Figure 4 visualizes the different behavioral signals clustered into 7 groups. In Figure 5, the correlation between the clusters of behavioral signals and identified segments is illustrated.
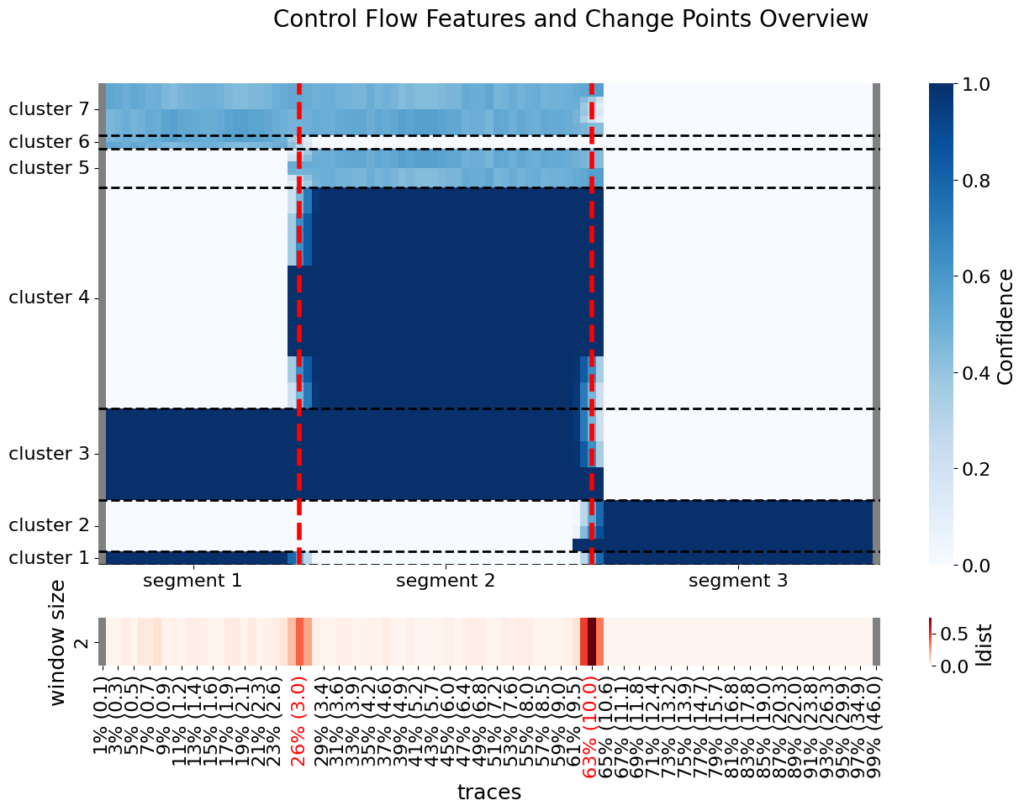
Figure 4: Control flow feature clusters derived from behavioral signals and change-point detection.
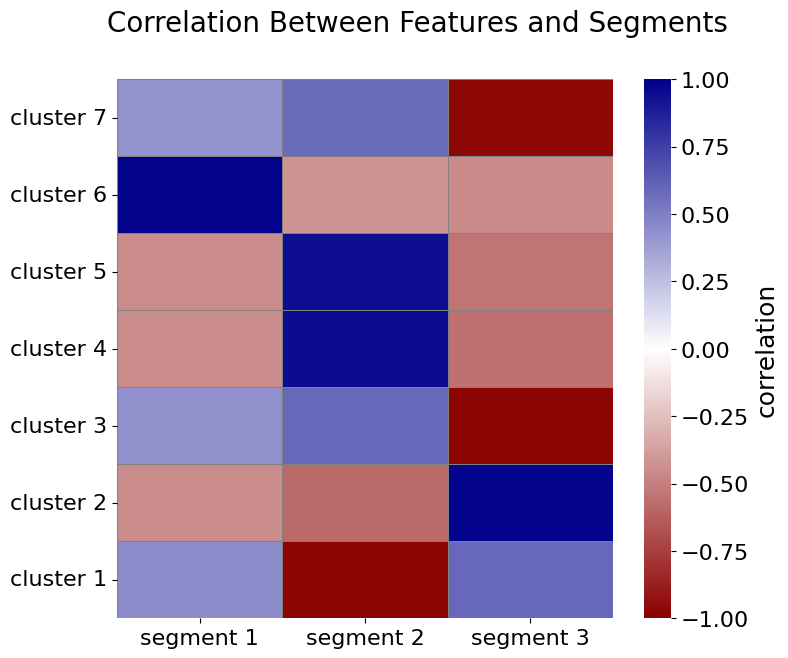
Figure 5: Correlation analysis between identified segments and behavioral feature clusters. The heatmap highlights positive and negative correlations, illustrating how specific clusters explain segment-level behaviors.
For instance, the strong negative correlation between Cluster 1 and Segment 2 indicates that the behavioral signals in this cluster have significantly higher values in other segments compared to Segment 2. To enhance readability, some examples of declarative constraints from Cluster 1, translated into natural language, are as follows:
* in-person appointment 2 must never occur.
* request documents must never occur.
The strong positive correlation between Cluster 2 and Segment 3 indicates that the behavioral signals in this cluster have significantly higher values in Segment 3 compared to other segments. Below are some examples of declarative constraints from Cluster 2:
* create application and cancel appointment occurs if and only if cancel appointment immediately follows create application.
* cancel appointment is the last to occur.
* check documents must never occur
* If create application occurs, then cancel appointment occurs immediately after it.
* in-person appointment 1 must never occur.
* cancel appointment occurs only if create application occurs immediately before it.
A comparison of the extracted explainability with the ground truth, as illustrated in Figure 1, demonstrates that the results align closely with the actual process dynamics. This indicates that the designed framework is both effective at identifying changes and capable of providing meaningful explanations for them.
Why This Matters
Traditional process mining methods often overlook the rich variability that exists across performance dimensions. Our framework addresses this gap by not only detecting process changes but also integrating explainability into the analysis. This empowers process experts to better understand the detected changes and take informed actions.
The result? A powerful tool for uncovering hidden inefficiencies, adapting workflows to dynamic requirements, and driving continuous improvement. Additionally, our open-source implementation ensures accessibility for organizations across industries, enabling widespread adoption and collaboration. Please check our GitHub repository for more information https://github.com/aliNorouzifar/X-PVI.
We are committed to continuous improvement, regularly updating the framework to enhance its functionality and usability. Your feedback and insights are invaluable to us. We welcome your suggestions and encourage you to report any issues or potential enhancements to further refine this approach. Here is my email address: ali.norouzifar@pads.rwth-aachen.de
References:
[1] Sato, D.M.V., De Freitas, S.C., Barddal, J.P. and Scalabrin, E.E., 2021. A survey on concept drift in process mining. ACM Computing Surveys (CSUR), 54(9), pp.1-38.
[2] Norouzifar, A., Rafiei, M., Dees, M. and van der Aalst, W., 2024, May. Process Variant Analysis Across Continuous Features: A Novel Framework. In International Conference on Business Process Modeling, Development and Support (pp. 129-142). Cham: Springer Nature Switzerland.
[3] Leemans, S.J., van der Aalst, W.M., Brockhoff, T. and Polyvyanyy, A., 2021. Stochastic process mining: Earth movers stochastic conformance. Information Systems, 102, p.101724.
[4] Di Ciccio, C. and Montali, M., 2022. Declarative Process Specifications: Reasoning, Discovery, Monitoring. Process mining handbook, 448, pp.108-152.
