
Kategorie: ‘Allgemein’
Federated Directly-Follows Graph Discovery
by Christian Rennert based on a paper by Christian Rennert, Julian Albers, Sander Leemans, and Wil van der Aalst
Federated process mining focuses on the problem of leveraging process mining methods for inter-organizational use cases while guaranteeing and preserving privacy of the individual event data. However, the desired outcomes should be as close or even identical to the outcomes as if all data was in one place to optimize the expressiveness of the obtained results. One paper that helps this aim is: “Your Secret Is Safe With Me: Federated Directly-Follows Graph Discovery” by Christian Rennert, Julian Albers, Sander Leemans, and Wil van der Aalst and that is going to be presented at ICPM 2025. In this paper, we suggest how to discover directly-follows graphs (DFGs) with homomorphic encryption to allow for a privacy-preserving, federated discovery between collaborating organizations. In the following, we outline the paper.
Key Concepts
- The Problem: In many cases, business processes span multiple organizations. For example, a patient’s treatment might involve a hospital and a general practitioner. However, while case IDs may already agree by default, i.e., due to the insurance ID, the hospitals or general practitioners might not know if they were both visited by any patient. Further, organizations may be unwilling to share their process data due to commercial sensitivity or privacy laws.
- The Goal: Extending the toolkit of federated process mining using a solution that leverages multi-party computation and homomorphic encryption. Thus, allowing organizations to perform inter-organizational analyses without sharing their private data in a readable form. The paper’s specific aim is to allow two organizations to create a directly-follows graph (DFG) of their combined process without revealing their individual event logs.
- The Solution: The paper introduces a new protocol that uses fully homomorphic encryption (FHE) to discover a DFG while keeping timestamps and activities secret. Unlike previous approaches, this protocol does not require a trusted third party, a majority of honest organizations, or prior knowledge of the workflow. It does, however, require organizations to have a common case ID (like a social security number) and to pre-negotiate which activities will be included in the final DFG.
The Two Protocols
The paper presents two main protocols, a highly secure one and a more efficient one, both of which utilize the same core subroutine for constructing DFG edges.
- Brute-Force Protocol (BF): This is a highly secure but computationally expensive approach. One organization encrypts its event sequence and sends it to the other organization, which then computes the encrypted DFG edges. The other organization shuffles the encrypted edges and sends them back to the first organization for decryption.
- Trace-Based Protocol (TB): This is a less costly but also less secure method. It reveals some information, specifically common case IDs and the number of events in each case. By making common case IDs transparent, it allows for faster computations. This protocol is considered to eliminate the need for trust in collaborating organizations, as they cannot corrupt computations.
The paper concludes that both protocols are feasible and correct, though the BF protocol is the only known one to also cover privacy of case IDs for DFG discovery.
You can find the full paper at the following link: https://leemans.ch/publications/papers/icpm2025rennert.pdf.
Configuring Large Reasoning Models using Process Mining: A Benchmark and a Case Study
This post has been authored by Dr. Alessandro Berti
In the ever-evolving landscape of artificial intelligence, Large Language Models (LLMs) have become indispensable tools for tackling complex tasks, but when it comes to scientific reasoning, transparency and logical rigor are paramount. Enter Large Reasoning Models (LRMs), a specialized breed of LLMs trained to explicitly articulate their chain-of-thought, making them ideal for domains like process mining where the journey to an answer is as critical as the destination itself. A recent paper titled “Configuring Large Reasoning Models using Process Mining: A Benchmark and a Case Study” by Alessandro Berti, Humam Kourani, Gyunam Park, and Wil M.P. van der Aalst dives deep into this intersection, proposing innovative ways to evaluate and fine-tune LRMs using process mining techniques. This work not only bridges AI and process mining but also offers practical tools for enhancing model performance in scientific applications.
Link to the paper (pre-print): https://www.techrxiv.org/doi/full/10.36227/techrxiv.174837580.06694064/v1
The paper kicks off by highlighting the limitations of standard LLMs in scientific contexts, where verifiable reasoning is essential. LRMs address this by producing textual “reasoning traces” that outline their step-by-step logic. However, evaluating these traces has been underexplored until now. Drawing from the PM-LLM-Benchmark v2.0, a comprehensive dataset of LLM responses to process mining prompts, the authors introduce a pipeline to dissect these traces. The process begins with extracting individual reasoning steps from the raw outputs, classifying each by type, such as Pattern Recognition for spotting anomalies, Deductive Reasoning for logical derivations, Inductive Reasoning for generalizing from data, Abductive Reasoning for inferring explanations, Hypothesis Generation for proposing testable ideas, Validation for verifying steps, Backtracking for revising errors, Ethical or Moral Reasoning for considering fairness, Counterfactual Reasoning for exploring alternatives, and Heuristic Reasoning for applying practical rules. Each step is further labeled by its effect on the overall reasoning: positive (advancing correctness), indifferent (neutral or redundant), or negative (introducing errors). This structured approach transforms unstructured text into analyzable JSON objects, enabling a nuanced assessment beyond mere output accuracy.
Building on this foundation, the authors extend the existing benchmark into PMLRM-Bench, which evaluates LRMs on both answer correctness and reasoning robustness. Using a composite score that rewards positive steps and correct conclusions while penalizing errors and inefficiencies, they test various models, revealing intriguing patterns. Top performers, like Grok-3-thinking-20250221 and Qwen-QwQ-32B, excel with high proportions of positive-effect steps, particularly in deductive and hypothesis-driven reasoning, correlating strongly with overall task success. Weaker models, conversely, suffer from over-reliance on speculative types without adequate validation, leading to more negative effects. The benchmark also breaks down performance by process mining categories, showing that tasks like conformance checking favor deductive reasoning, while hypothesis generation benefits from exploratory types. A validation check using multiple LLMs as judges confirms the classification’s reliability, with over 82% agreement.
The real-world applicability shines in the case study on the QwQ-32B model, a 32-billion-parameter LRM refined for complex reasoning. By tweaking system prompts to emphasize or suppress specific reasoning types—such as boosting Hypothesis Generation or Ethical Reasoning—the authors demonstrate targeted improvements. For instance, increasing Hypothesis Generation enhanced scores in exploratory tasks like contextual understanding and conformance checking, pushing the overall benchmark score to 37.1 from the baseline’s 36.9. Reducing it, however, hampered performance in hypothesis-heavy categories. Adjustments to Ethical Reasoning showed mixed results, improving reasoning quality in fairness tasks but sometimes overcomplicating others without net gains. These experiments underscore the trade-offs in LRM configuration, proving that process mining-inspired analysis can guide precise tweaks for domain-specific optimization.
In conclusion, this paper paves the way for more interpretable and configurable AI in scientific fields. By treating reasoning traces as process logs, it applies process mining to uncover strengths, weaknesses, and optimization paths in LRMs. While reliant on accurate LLM-based classification and potentially overlooking latent model intricacies, the framework’s generalizability extends beyond process mining to any reasoning-intensive domain. Future enhancements could incorporate ensemble judging or human oversight to refine accuracy. For process mining enthusiasts, this work is a call to action: leveraging benchmarks like PMLRM-Bench could unlock new levels of AI-assisted discovery, making complex analyses more reliable and efficient. The full resources, including the benchmark and case study data, are available on GitHub, inviting further exploration and collaboration.
Visualizing Object-Centric Petri Nets
by Lukas Liss based on a paper by Tobias Brachmann, István Koren, Lukas Liss, and Wil van der Aalst
Process mining has become essential for understanding how organizations actually work, but there’s been a fundamental limitation: traditional approaches focus on single entities like “orders” or “customers,” missing the bigger picture of how multiple entities interact in real business processes.
The Challenge: Beyond Single-Case Thinking
Imagine analyzing an e-commerce process. Traditional process mining might follow individual orders from creation to delivery. However, real business processes are more complex – orders involve products, customers, warehouses, and shipping providers, all interacting in intricate ways. A single order might involve multiple products, each with different suppliers and delivery requirements. This complexity gets lost when we only look at one type of entity at a time.
This is where Object-Centric Process Mining (OCPM) comes in. Instead of following just orders or just customers, OCPM tracks all the different types of objects and their interactions simultaneously. An established process model for this are Object-Centric Petri Nets (OCPNs) – a more sophisticated way to model processes that can handle multiple interacting lifecycles.
The Visualization Problem
Here’s where things get tricky: these richer, more realistic process models are much harder to visualize clearly. Traditional Petri net visualization tools weren’t designed for this complexity. When you have multiple object types, variable connections between them, and complex interdependencies, standard graph layout algorithms produce cluttered, hard-to-interpret diagrams.
Think of it like trying to use a city road map to understand a complex subway system with multiple interconnected lines – the visualization just wasn’t designed for that level of complexity.
Our Solution: A Tailored Visualization Approach
Our research addresses this gap by developing a specialized layout algorithm specifically designed for OCPNs. Rather than forcing these complex models into generic graph visualization tools, we created an approach that understands and leverages the unique characteristics of object-centric processes.
Key Innovations
- Smart Quality Metrics We defined six quality metrics that guide the visualization:
- Traditional graph aesthetics (minimizing edge crossings, reducing edge length)
- Object-centric considerations (grouping related object types, maintaining clear flow direction)
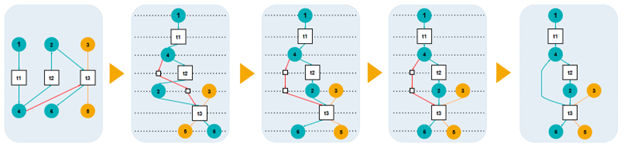
- Adapted Sugiyama Algorithm We extended the well-known Sugiyama framework – a hierarchical graph layout method – to handle object-centric specifics:
- Cycle Breaking: Handling loops in process flows
- Layer Assignment: Organizing elements into logical hierarchical levels
- Vertex Ordering: Arranging elements within each level to minimize visual confusion
- Positioning & Routing: Computing final coordinates and drawing clean connections
- Object-Type Awareness Unlike generic tools, our algorithm actively groups places (representing object states) by their object type, making it easier to understand how different business entities flow through the process.
Real-World Impact
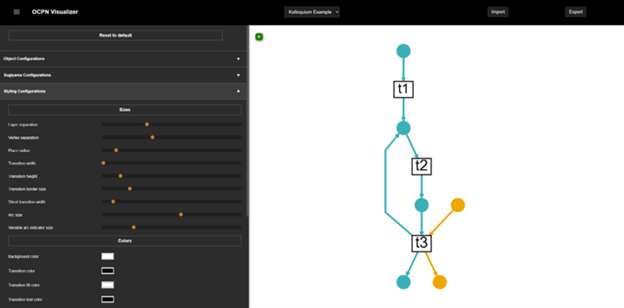
We built this into a practical tool called the OCPN Visualizer – a web-based application that researchers and practitioners can use. The tool includes:
- Interactive configuration options for customizing layouts
- Real-time visualization updates as you adjust parameters
- Export capabilities for integration into other workflows
- A reusable JavaScript library for developers
Why This Matters
This work addresses a real bottleneck in object-centric process mining adoption. As organizations increasingly recognize the value of understanding their complex, interconnected processes, they need tools that can make this complexity manageable and interpretable.
The research contributes to the field in three ways:
- Theoretical Foundation: Quality metrics that combine graph aesthetics with domain-specific needs
- Algorithmic Innovation: A layout algorithm tailored to object-centric characteristics
- Practical Tools: Open-source implementations that others can use and build upon
Looking Forward
While our approach works well for small to medium-sized models, there’s still room for improvement with very large, complex process models. Future work could explore more advanced edge routing techniques, better handling of dense interconnections, and more sophisticated filtering options for exploring large models.
The broader impact extends beyond just visualization – by making object-centric process models more interpretable, this work helps bridge the gap between advanced process mining techniques and their practical application in real organizations.
Resources
Find the source code, a link to the web-based tool, and example input data on Github: https://github.com/rwth-pads/ocpn-visualizer
Selecting Behavior from Uncertainty: Process Discovery on Uncertain Event Logs
This post has been authored by Marco Pegoraro.
Introduction
Process mining bridges the gap between data science and business process management by extracting insights from event logs—records of activities captured by modern information systems. Traditional discovery techniques assume event data is precise and accurately recorded, but in many real-world settings, logs contain explicit uncertainty, such as ambiguous timestamps or multiple possible activity labels. In [1] we introduce the concept of uncertain event logs, aiming to extend conformance and discovery algorithms to handle data imprecision without discarding valuable information.
Why Uncertainty Matters
In practice, data imperfections arise from manual entries, system delays, or coarse timestamp granularity. For example, two activities may share the same recorded time unit, making their order unclear, or a sensor might register one of several possible activity types. Ignoring such uncertainties can lead to misleading models or force analysts to prune important cases. By explicitly modeling uncertainty, process mining can produce more faithful representations of actual behavior, highlighting both certain and ambiguous aspects of the process.
A Taxonomy of Uncertain Event Logs
Uncertain event data is classified into two main categories:
- Strong uncertainty, where the log lists all possible values for an attribute without probabilities (e.g., an event’s activity label is either “Approve” or “Reject”). Table 1 shows an example of strongly uncertain trace.
- Weak uncertainty, where a probability distribution over possible values is provided.
Logs displaying, respectively, strong and weak uncertainty on activity labels are also known in literature as stochastically-known an stochastically-unkown logs [2].
Their focus is on a simplified subset of uncertain behavior that encompasses strong uncertainty on control flow attributes: activity names, timestamps (expressed as intervals), and indeterminate events whose presence is optional. This clear taxonomy guides the design of algorithms that handle varying levels of data confidence.
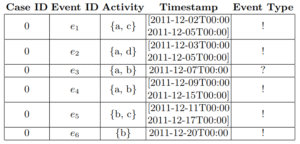
Table 1: An example of strongly uncertain trace. Possible activity labels for events are enclosed in curly braces. Uncertain timestamps are represented by time intervals. Event e3 is indeterminate: it might have been recorded without occurring.
Capturing Uncertain Behavior with Graphs
In [3], we describe an extension of the Inductive Miner family of algorithms able to ingest strongly uncertain event logs.
At the core of the proposed approach is the uncertain directly-follows graph (UDFG)—an extension of the classic directly-follows graph that retains information about ambiguity. Instead of a single directed edge from activity labels A to B representing that B directly follows A, the UDFG records:
- Certain edges, where all traces support the relation A→B.
- Possible edges, where some traces may support A→B under certain resolutions of uncertainty.
The nodes are also enriched with the same parameters, in relation to the certain executions of a single activity, and the possible executions of a single activity. As a result, the UDFG succinctly encodes where the process behavior (as illustrated by the data) is definitive, and where alternate real-life scenarios exist.
Discovering Models from Uncertain Data
To transform the UDFG into an interpretable process model, we apply inductive mining—a robust technique that produces block-structured models free of spurious behavior. The workflow is:
- Construct the UDFG from the uncertain log, marking edges as certain or possible.
- Filter edges with a specific set/configuration of parameters, which induce inclusion/exclusion criteria for uncertain aspects of the input log.
- Apply inductive mining: we obtain a process tree from the filtered UDFG, through the Inductive Miner directly-follows algorithm [4].
- Merge results to highlight which parts of the model are supported by all possible interpretations and which depend on resolving uncertainty.
This dual-mining strategy yields two related models: one conservative and one inclusive, giving analysts a spectrum of process variants to consider.
Experimental Insights
In their experiments on both synthetic and real-world logs, we show that:
- The UDFG can be easily defined and obtained even for large logs with complex uncertainty patterns.
- Models derived from a “traditional” (certain) DFG avoid underfitting noise but may miss legitimate behavior expressed by uncertainty.
- Inclusive models reveal potential flows that warrant further data cleaning or validation.
Overall, the approach offers filtering mechanisms that can balance precision and fitness, allowing process mining specialists to control how conservatively or aggressively they treat uncertain data.
Conclusion and Future Directions
By embracing rather than discarding uncertainty, this work advances process discovery to better reflect real-life data quality issues. The proposed UDFG and dual inductive mining deliver models that clearly distinguish between guaranteed and hypothetical behavior. The authors highlight several avenues for future research, including:
- Defining quantitative metrics to compare uncertain models.
- Extending the approach to weak uncertainty with probability distributions.
- Incorporating uncertainty in case identifiers and other perspectives beyond control flow.
For practitioners, this paper offers practical guidance on modeling and visualizing ambiguous traces, ensuring that insights remain grounded in the realities of data collection.
References
- Pegoraro, Marco, and Wil M.P. van der Aalst. “Mining uncertain event data in process mining.” In 2019 International Conference on Process Mining (ICPM), pp. 89-96. IEEE, 2019.
- Bogdanov, Eli, Izack Cohen, and Avigdor Gal. “Conformance checking over stochastically known logs.” In International Conference on Business Process Management, pp. 105-119. Cham: Springer International Publishing, 2022.
- Pegoraro, Marco, Merih Seran Uysal, and Wil M.P. van der Aalst. “Discovering process models from uncertain event data.” In International Conference on Business Process Management, pp. 238-249. Cham: Springer International Publishing, 2019.
-
Leemans, Sander J.J., Dirk Fahland, and Wil M.P. van der Aalst. “Scalable process discovery and conformance checking.” Software & Systems Modeling 17 (2018): 599-631.
Object-Centric Process Mining: A New Perspective for Sustainability Analysis
This post has been authored by Nina Graves.
Current approaches to organizational sustainability analysis face significant methodological challenges. Life Cycle Assessment (LCA) and similar frameworks require time-consuming manual data collection, rely on static models, and struggle to connect environmental impacts to their process-level causes. This often results in sustainability analysis becoming a reporting exercise rather than an integrated management approach.
Object-Centric Process Mining (OCPM) represents a methodological advancement that may address these limitations. The approach leverages Object-Centric Event Logs (OCEL), which capture relationships between events and multiple objects in business processes. The OCEL data structure contains timestamps, activities, objects, and their attributes—allowing for multi-dimensional analysis.
When enhanced with sustainability metrics, these logs provide a structural foundation for more granular environmental impact assessment. The methodology integrates inventory data, impact factors, and allocation mechanisms directly with process execution data.
Recent Work
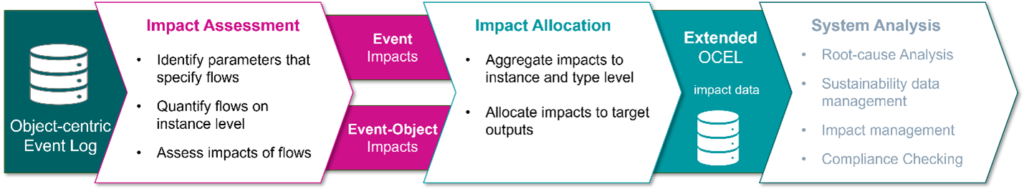
In our recent explorative paper, we used an exemplary OCEL to explore and discuss the usage of OCPM for sustainability assessment. We showcased an approach in which a sustainability-enriched OCEL is used for 1) impact detection, 2) impact allocation, to enable 3) system analysis.
We demonstrated the analytical capabilities to track environmental impacts across the process, supporting the
- determination of sustainability-related data from an OCEL,
- storage of sustainability data using an OCEL,
- automated modelling of complex process landscapes,
- flexible impact allocation, and
- potential automation for impact detection using impact databases.
Furthermore, we showed that the OCEL can support more accurate and flexible impact assessment and analysis by combining the same sustainability data used for traditional sustainability assessment with event data.

Figure 1- Example for more differentiated and accurate impact considerations.
The distinguishing differences lie in:
- Multi-level analysis: Environmental impacts are calculated for individual instances (events and objects) which can be aggregated and differentiated, e.g., to activities or object types or by specific attributes.
- Multi-perspective analysis: The environmental impact can be considered with regard to different organizational elements, such as products, resources, total systems, individual (sub-)processes,…
- Combining difference reference units: The OCEL allows for the association of relevant primary data to events, (sets of) objects, and event-object combinations. This requires less allocation efforts in the pre-processing of the data enabling a stronger decoupling of impact assessment and impact allocation. This decoupling allows for the previously mentioned increased flexibility.
Naturally, the integration of sustainability data also allows for the application of OCPM techniques for causal investigations and may potentially even support impact management and compliance checking.
PoC Web Application: OCEAn – Object-Centric Environmental Analysis
As a proof of concept, we provide OCEAn—a software tool that links company data with sustainability information. It enables the definition of environmental impact rules, supports semi-automatic data processing, and provides various visualizations of results.
OCEAn supports:
- Integration of environmental data with process event logs
- Definition of impact rules at activity and attribute levels
- Multiple allocation algorithms based on object relationships
- Different visualization of environmental impacts
Discussion
The research presents both methodological advantages and challenges.
Advantages:
- Leverages existing digital process traces
- Aligns process management with sustainability objectives
- Supports more accurate impact allocation through object relationships
- Enables root cause analysis of environmental hotspots
- Provides a data-driven foundation for ongoing assessment
Limitations:
- Limited by data availability and quality
- Requires identifiable process elements
- Depends on comprehensive domain expertise
- Allocation methodologies require further development
- Extracting OCELs and enhancement with sustainability data
This exploratory work establishes a foundation for further investigation into data-driven sustainability assessment. Future research directions include developing standardized frameworks for sustainability-enhanced OCELs, more sophisticated allocation methodologies, and improved visualization techniques for complex impact relationships.
The work contributes to bridging conceptual gaps between process science and sustainability science, potentially enabling more dynamic and comprehensive environmental performance assessment in organizational contexts.
References:
Find the Paper on Research Gate: https://www.researchgate.net/publication/391736048_Object-Centric_Process_Mining_for_Semi-Automated_and_Multi-Perspective_Sustainability_Analyses
Repository: https://github.com/rwth-pads/ocel4lca
Developing Tooling for Models-in-the-Middle
This post has been authored by Leah Tacke genannt Unterberg.
In the Cluster of Excellence “Internet of Production” (IoP) of RWTH Aachen University, the concept of Models-in-the-Middle (MitM) has been proposed to avoid the recurring development of custom data pipelines from source to analytics.
The project and its predecessor have been running for over ten years, with over 100 financed researcher positions from over 30 institutes/independent organizational units, each with their own goals. Over time, the isolated development of “data infrastructures” – which has historically not been a research activity in the field of mechanical engineering – has led to the expenditure of much duplicated effort.
As data is the basis for basically all the promises of the project and any shiny AI application, every researcher needs to have some kind of pipeline from data as it is produced by sensors, machines, etc., to algorithms running on their laptop, their institute’s server, or the cloud. As coordination on that front has not been part of the project’s realization, barely any reusable artifacts have been created, shared, and curated within the IoP. This includes IoP-accessible data sets themselves, but that is another story…
To be able to perform data-based research more efficiently, shared data models that can serve as the basis for implementation interfaces across a whole domain may be quite useful. In the domain of process mining, this has been shown to be quite the enabler. See XES, ProM, and now the OCED Model.
Essentially, as any standardization argument goes, an agreed-upon model and representation drives collaboration, reuse/adaptation of existing tools, and thus, broadens the horizon for newcomers into the project.
The following graphic exemplifies this situation.
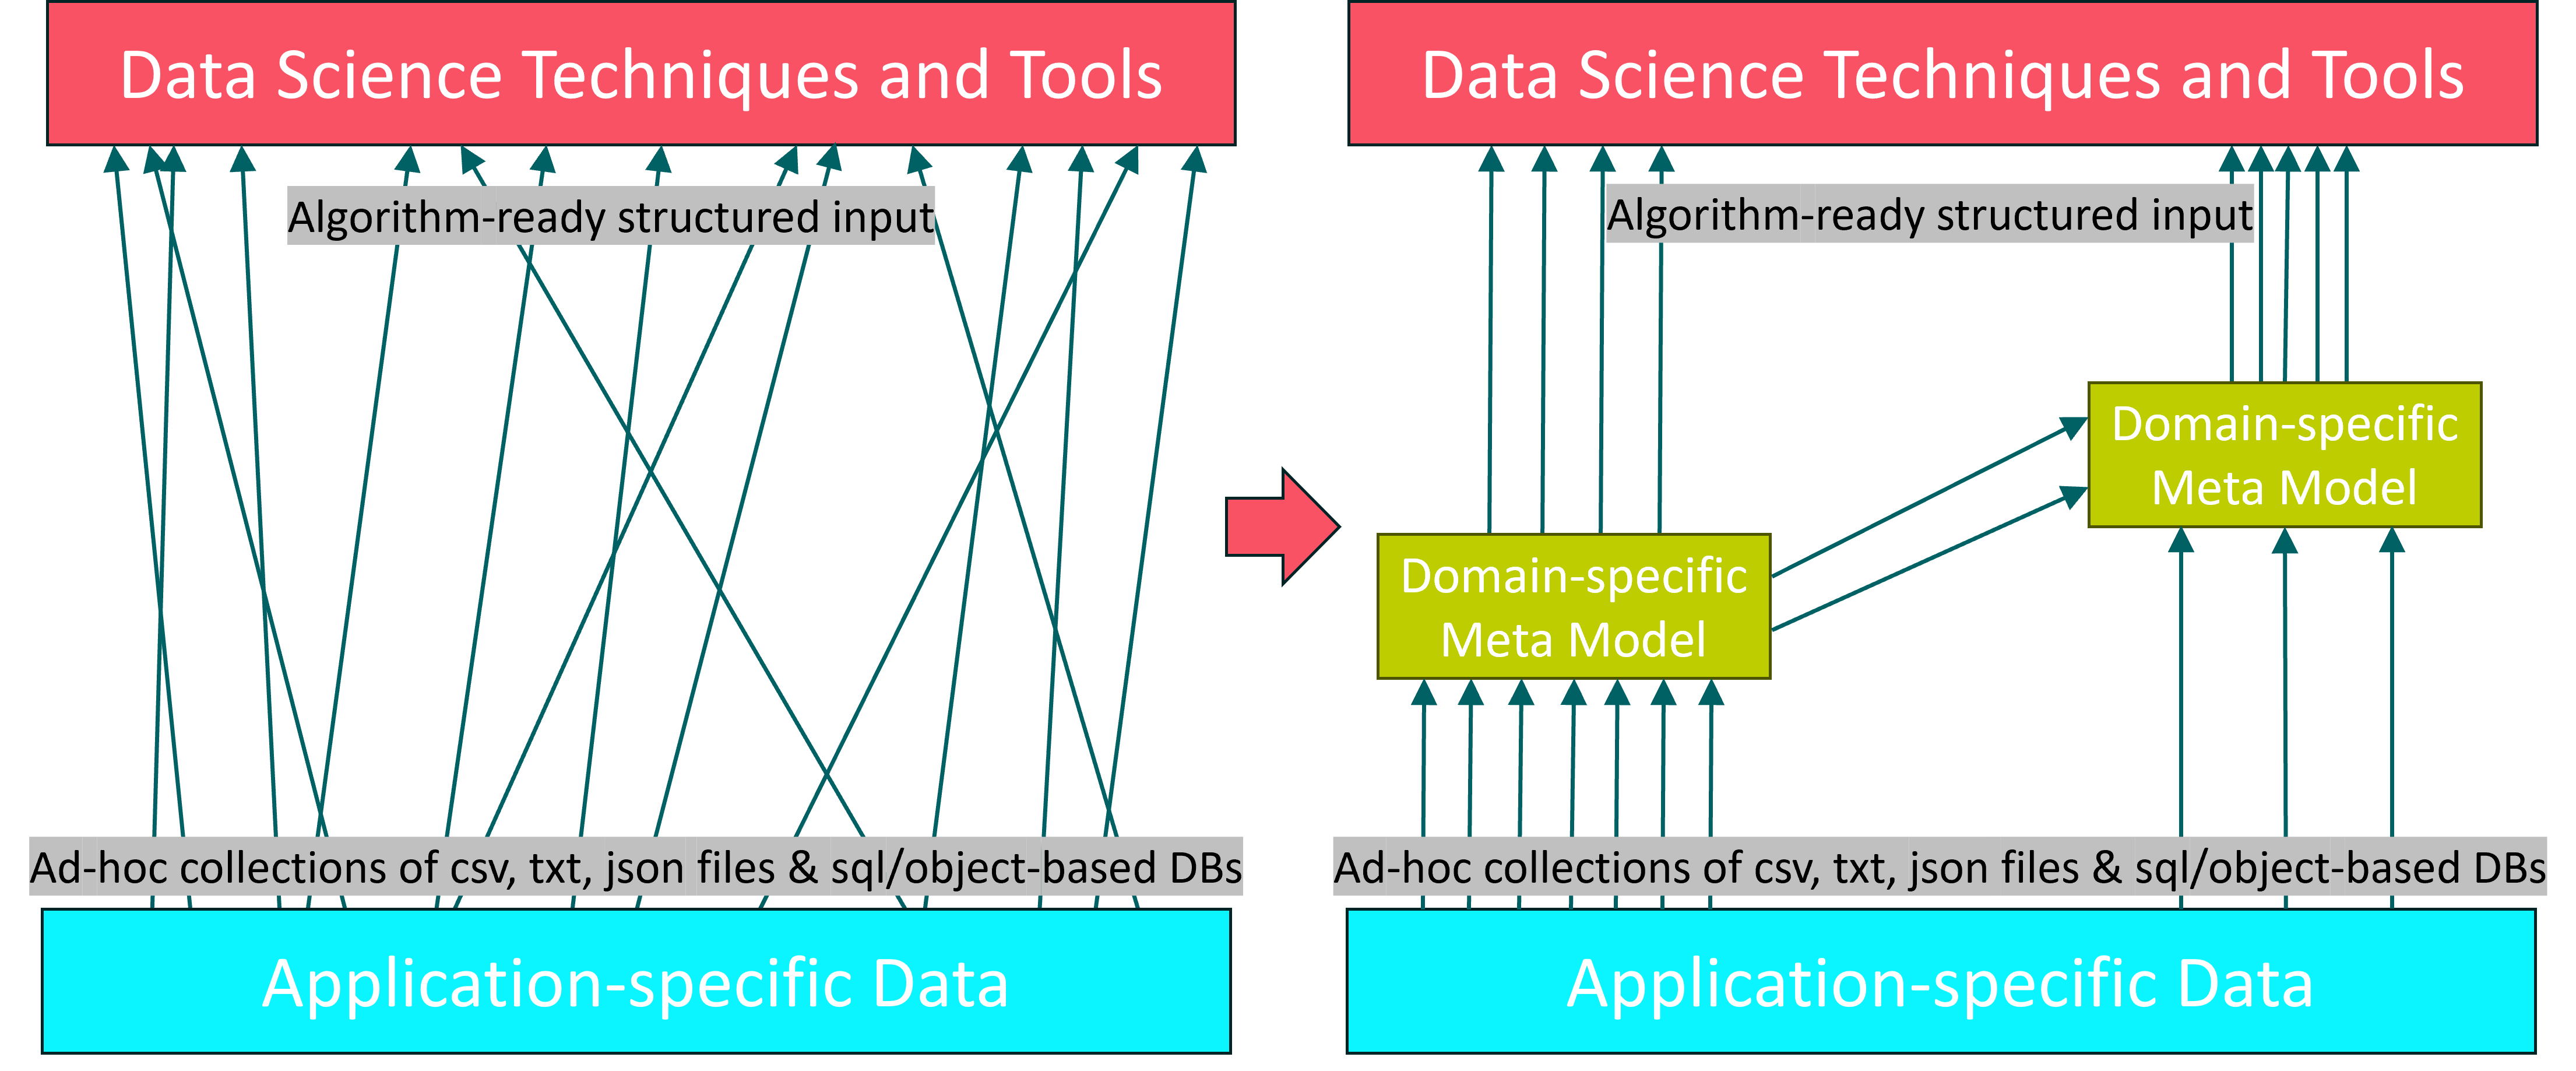
As the most prominent type of data in the IoP is that coming from sensors and machines during operation, we have introduced a specialized model for it.
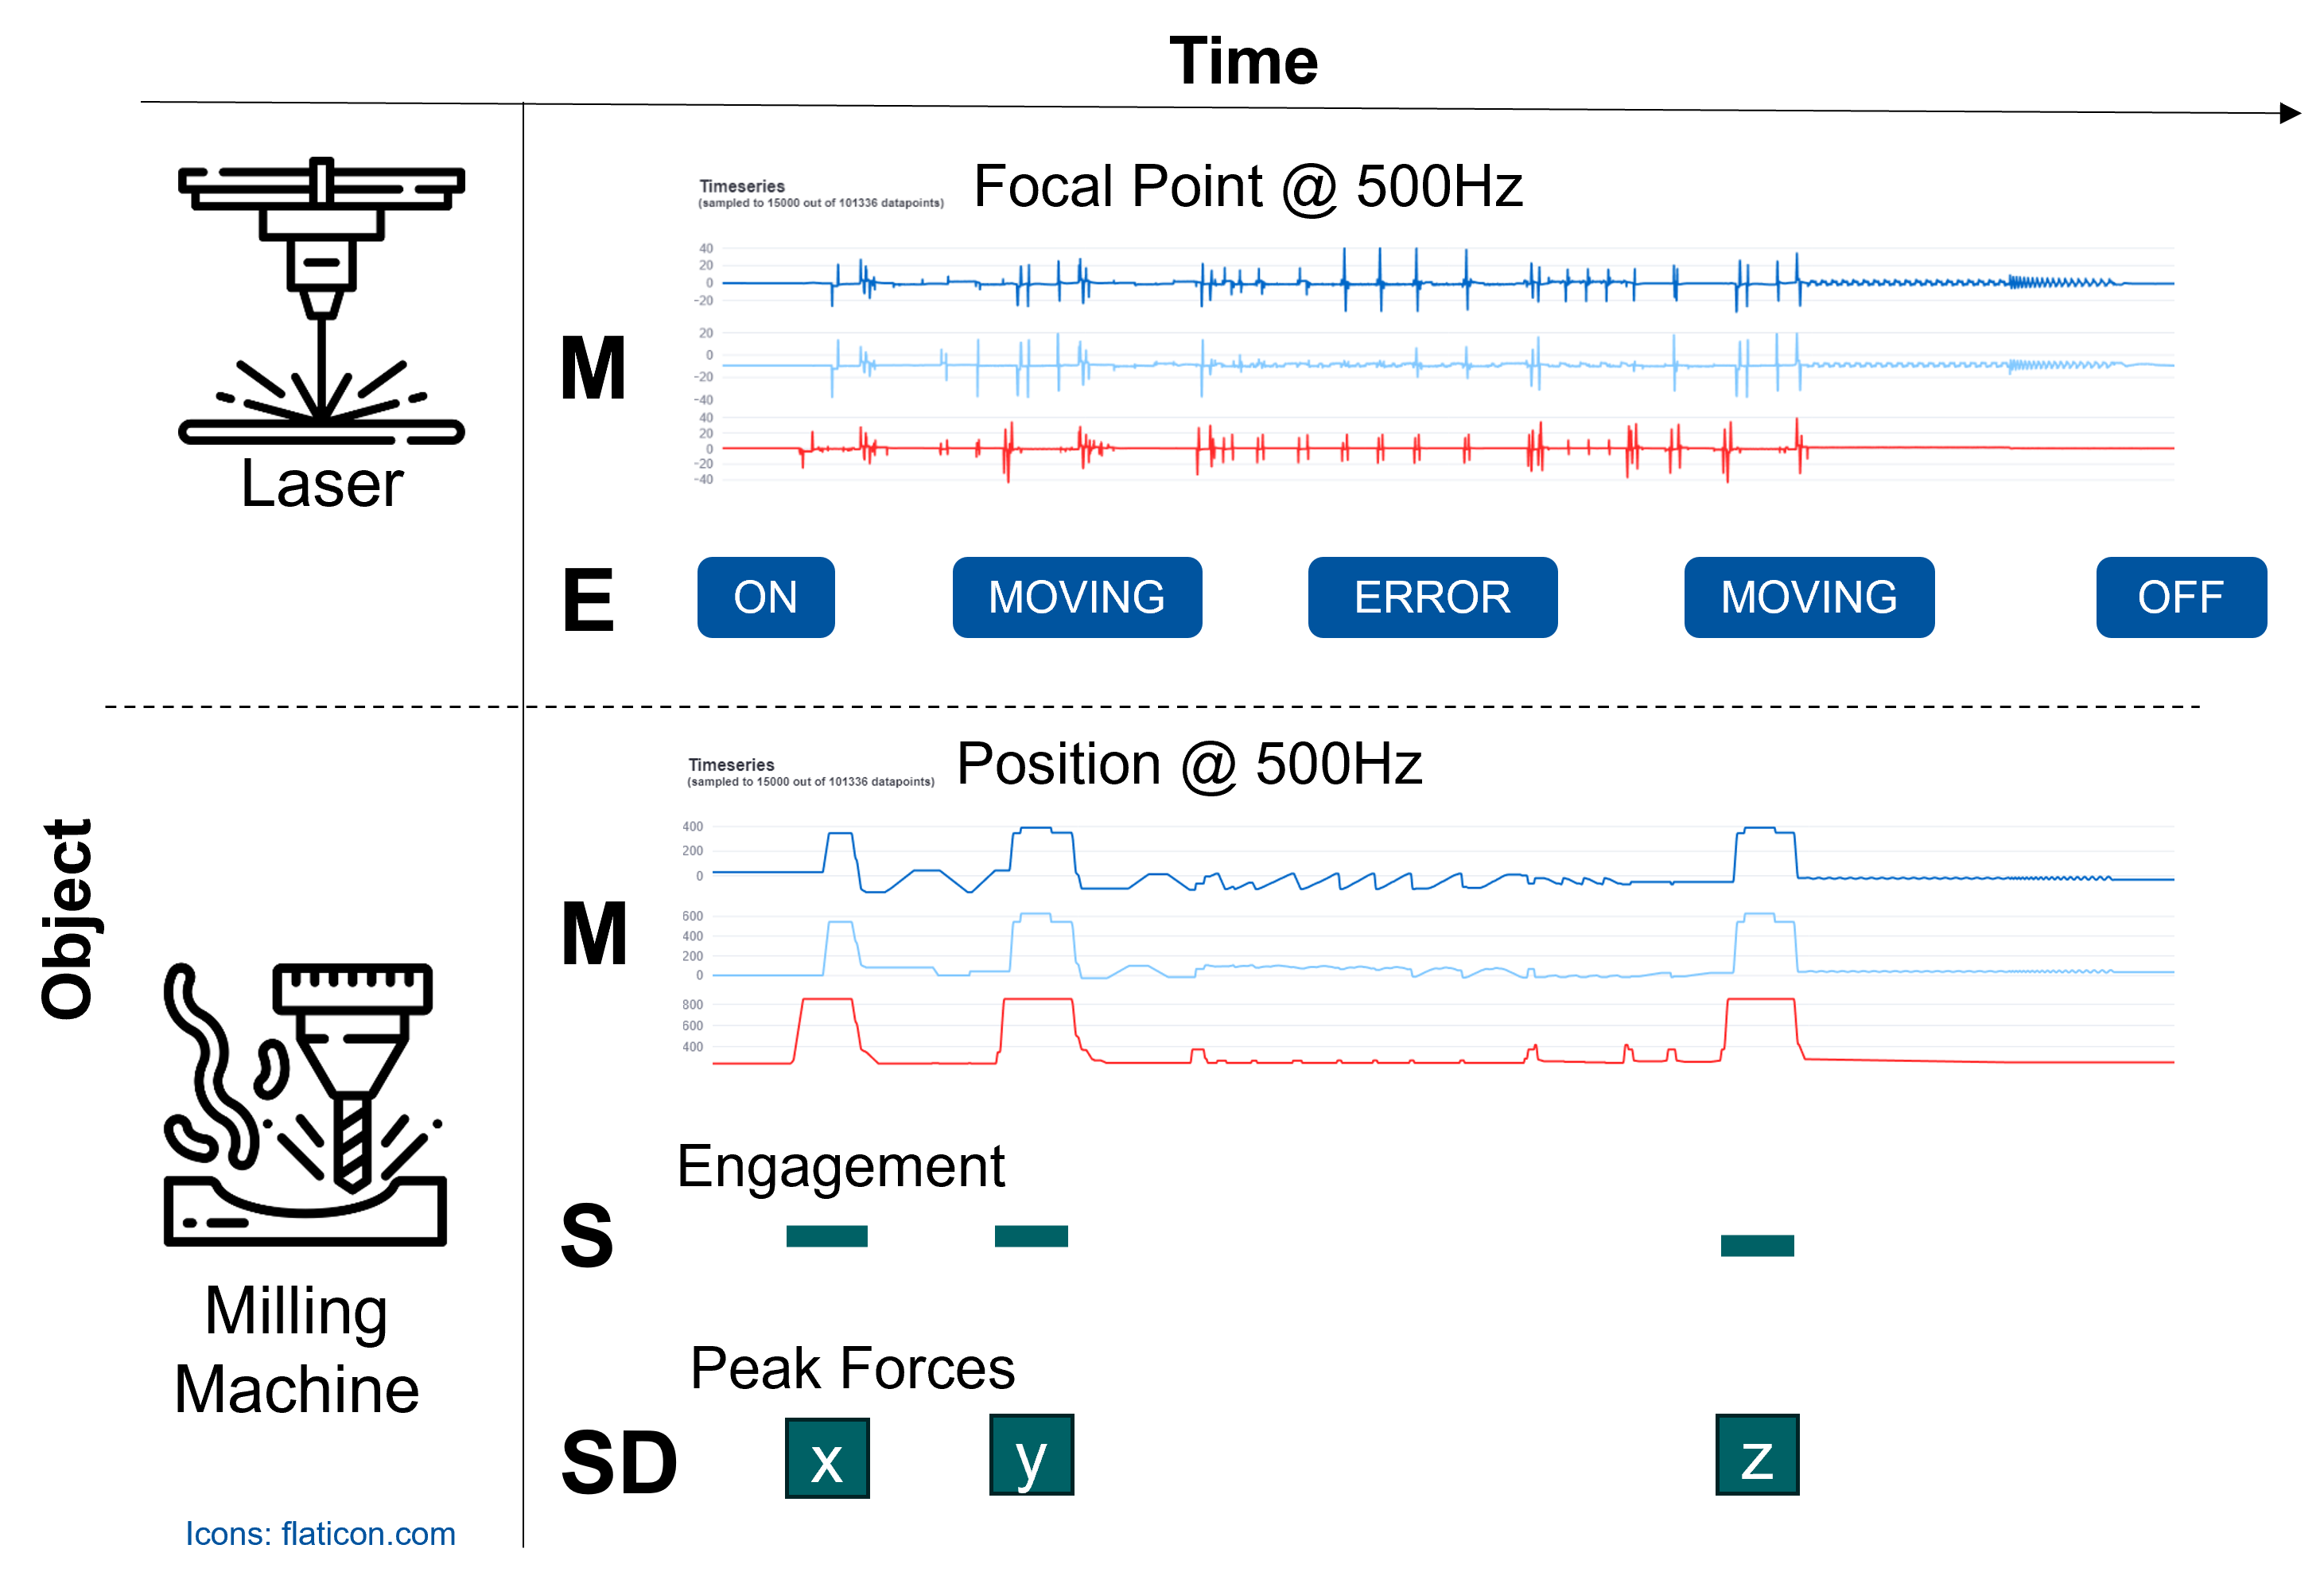
It focuses on the aspect of time and specifically aims to support rich time series analysis via the inclusion of time intervals/segments which play a major role in the data pre-processing in this domain, as data is often continuously recorded and needs to be cut into individual operations, regimes, etc.
Consider the following model and schematic example of the proposed data model for Measurement and Event Data (MAED).

To start, we developed a tool for finding, mapping, and exporting, MAED-conforming data from relational databases – which typically lie at the heart of a research institute that documents its experiments.
Well, in the best case that is. It can also lie on a thumb drive of a researcher who’s no longer employed there.
Projects like Apache Hive extend the reach of SQL queries to JSON and object-oriented data stores, so assuming some tabular interface is not too far-fetched for most use-cases.
MAED (MitM) Exporter
Enter, the MAED Exporter WebApp. It can connect to most relevant DBMS (via sqlachemy and generate MAED data sets in the proposed text-based representation.
The project is available here and hosted https://maed-exporter.cluster.iop.rwth-aachen.de/.

The user can iteratively explore, transform, and map the tables of the connected DB (or uploaded sqlite file).
Finally, the resulting virtual table definitions, mappings, and queried and transformed data sets can be exported.
Once the mapping work is done and saved as a preset, data sets can be exported on demand, and, in future extensions, be queried directly by visualization tooling.
Generalization
When developing the exporter, we envisioned to support not just this specific data model in its current iteration, but rather to make the implementation configurable to any data model expressed in a JSON configuration file.
The result is that the exporter app itself lives on the level “connecting relational data to meta-modeled concepts” instead of “connecting relational data to MAED”. Hence, it can be considered a MitM Exporter, not just MAED.
The next logical step after getting data in the specified representation is of course to display it.
MitM Superset
To make this tooling robust, scalable, reusable, and extensible to the extent that single-person research projects typically are not, we decided to customize Apache Superset, an open-source “dashboarding” tool.
While the upfront effort required is immense compared to starting from scratch, there are great benefits from adapting software that has 1200 contributors. For one, the project is developed to a high standard with regard to security and scalability. Further, there are some features that make it very extensible, e.g., the ability to create new visualizations entirely in the frontend by providing it as a plugin that reuses code from the superset core.
To connect MitM data to such a tool, we first developed a canonical relational representation of the “family of MitMs” that can be described like MAED.
Based on this, we can create interactive dashboards that can give a comprehensive overview over specific data sets.
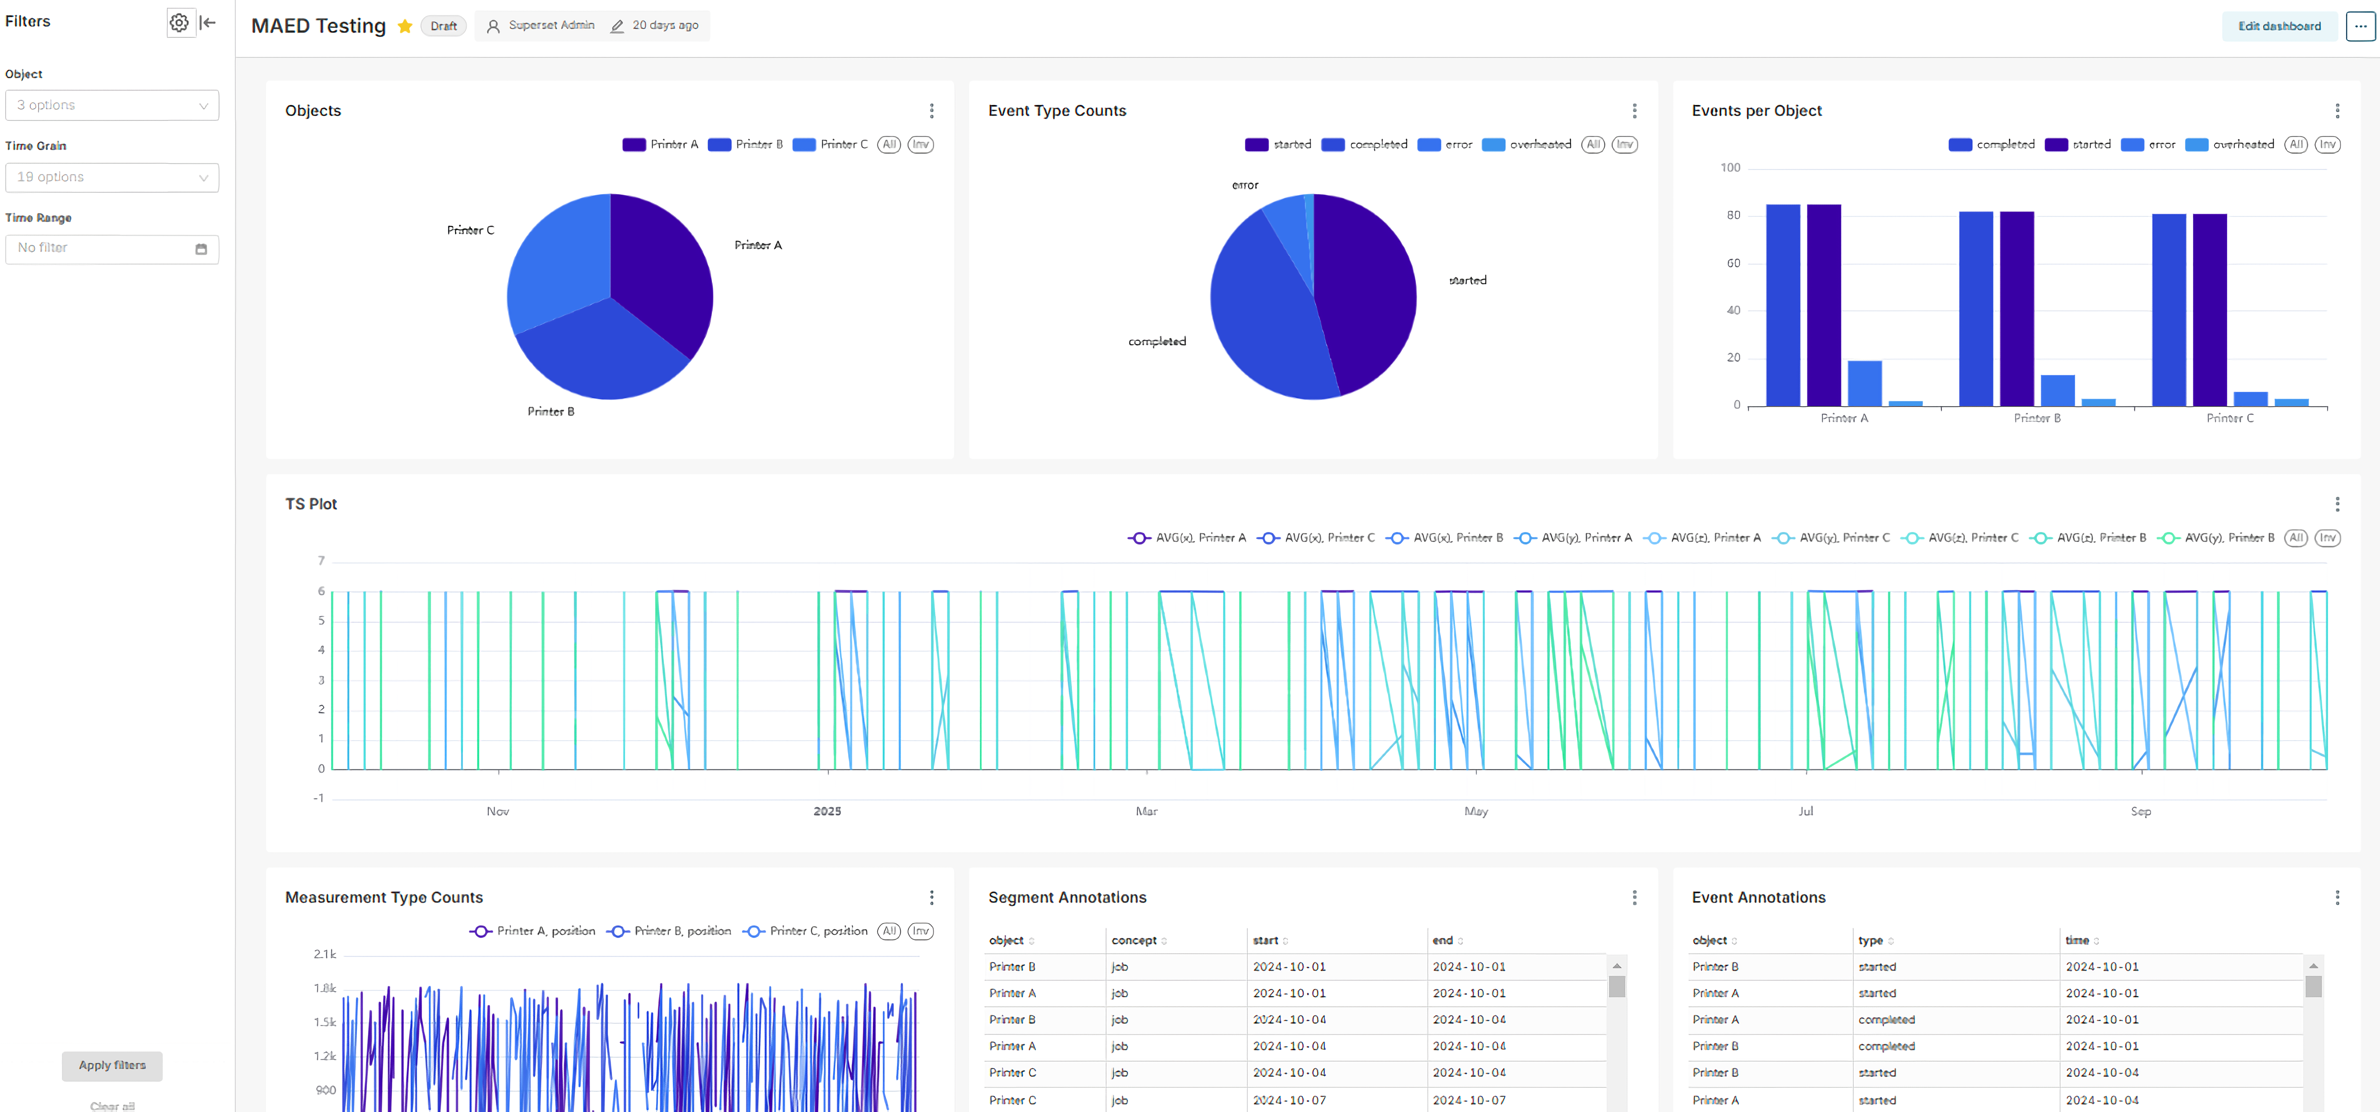
In the beginning, the process of importing the data into a Superset instance would be manual, but we have started to implement a Superset fork that has “native MitM support”, i.e., that knows about the concept of MitMDataset in addition to the usual Database, Table, Chart and Dashboard.
Our fork includes an architectural extension to the regular Superset docker-compose network: independent MitM services can be added to the network, and their APIs be reached from the Superset front- and backend.
You can follow the development here.
The first hosted instance should be available in mid-April.
Can AI Really Model Your Business Processes? A Deep Dive into LLMs and BPM
This post has been authored by Humam Kourani.
Business process modeling (BPM) is crucial for understanding, analyzing, and improving how a company operates. Traditionally, this has involved painstaking manual work. But what if Artificial Intelligence could lend a hand? Large Language Models (LLMs) are showing promise in this area, offering the potential to automate and enhance the BPM process. Let’s dive into how LLMs are being used, how effective they can be, and what the research shows.
What is Process Modeling (and Why Does it Matter)?
Before we get to the AI, let’s quickly recap the basics. Process modeling is all about representing the steps, actions, and interactions within a business process. The goal is to:
- Understand: Make complex operations clear and visible.
- Analyze: Identify bottlenecks, inefficiencies, and areas for improvement.
- Improve: Optimize workflows for better performance, reduced costs, and increased customer satisfaction.
Enter the LLMs: AI-Powered Process Modeling
The core idea is to leverage the power of LLMs to automatically generate and refine process models based on natural language descriptions. Imagine simply describing your process in plain text, and having an AI create a BPMN diagram for you! The general framework involves:
- Starts with Natural Language: You describe the process in words.
- Uses POWL as an Intermediate: The LLM translates the description into the Partially Ordered Workflow Language (POWL).
- Generates Standard Models: The POWL representation is then converted into standard notations like BPMN or Petri nets.

Figure 1: AI-Powered process modeling using POWL for intermediate representation.
Why POWL for intermediate representation?
The Partially Ordered Workflow Language (POWL) [1] serves as a crucial bridge in our AI-powered process modeling framework. Unlike some traditional modeling notations, POWL is designed with a hierarchical, semi-block structure that inherently guarantees soundness. This means we can avoid common modeling errors like deadlocks. Furthermore, POWL has a higher expressive power compared to hierarchical modeling languages that provide similar quality guarantees. The resulting POWL models can be seamlessly converted into standard notations like BPMN and Petri nets for wider use.
Fine-Tuning vs. Prompt Engineering: A Key Choice
A fundamental question in working with LLMs is how to best tailor them to a specific task:
- Fine-Tuning: Retraining the LLM on a specific dataset. This is highly tailored but expensive and requires significant data.
- Prompt Engineering: Crafting clever prompts to guide the LLM. This is more adaptable and versatile but requires skill in prompt design.
The LLM-Based Process Modeling Framework: A Closer Look
Our framework [2] is iterative and involves several key steps:
1. Prompt Engineering: This includes the following strategies:
- Knowledge Injection: Providing the LLM with specific information about POWL and how to generate POWL models.
- Few-Shots Learning: Giving the LLM examples of process descriptions and their corresponding models.
- Negative Prompting: Telling the LLM what not to do, avoiding common errors.
2.Model Generation: The LLM generates executable code (in this case, representing the POWL model). This code is then validated for correctness and compliance with the coding guidelines and the POWL specifications.
3.Error Handling:The system detects errors (both critical functional errors and less critical qualitative issues) and prompts the LLM to fix them.
4.Model Refinement: Users can provide feedback in natural language, and the LLM uses this feedback to improve the model.

Figure 2: LLM-Based process modeling framework.
ProMoAI: A Practical Tool
ProMoAI [3] is a tool that implements this framework. Key features of ProMoAI include:
- Support for Multiple LLMs: It can work with LLMs from various AI providers, including Google, OpenAI, DeepSeek, Anthropic, and DeepInfra.
- Flexible Input: Users can input text descriptions, existing models, or data.
- Multiple Output Views: It can generate models in BPMN, POWL, and Petri net formats.
- Interactive Feedback: Users can provide feedback and see the model updated in real-time.

Figure 3: ProMoAI (https://promoai.streamlit.app/).
Benchmarking the Best: Which LLMs Perform Best?
We’ve benchmarked various state-of-the-art LLMs on their process modeling capabilities [4]. This involves testing quality (how well the generated models match the ground truth, using conformance checking with simulated event logs) and time performance (how long it took to generate the models).
Our extensive testing, using a diverse set of business processes, revealed significant performance variations across different LLMs. Some models consistently achieved higher quality scores, closely approaching the ideal, while others demonstrated faster processing times.

Figure 4:Benchmarking results: average quality score, total time, time per iteration, and number of iterations for different LLMs.
Key Findings:
- A crucial finding was a positive correlation between efficient error handling and overall model quality. LLMs that required fewer attempts to generate a valid, error-free model tended to produce higher-quality results overall.
- Despite the variability in individual runs, we observed consistent quality trends within similar groups of LLMs. This implies that while specific outputs might differ, the overall performance level of a particular LLM type tends to be relatively stable.
- Some speed-optimized models maintained quality comparable to their base counterparts, while others showed a noticeable drop in quality. This highlights the trade-offs involved in optimizing for speed.
Can LLMs Improve Themselves? Self-Improvement Strategies
We’re exploring whether LLMs can improve their own performance through self-evaluation and optimization. Several strategies are being investigated:
- LLM Self-Evaluation: The LLM evaluates and selects the best model from a set of candidates it generates. We found the effectiveness of this strategy to be highly dependent on the specific LLM. Some models showed improvement, while others performed worse after self-evaluation.
- LLM Self-Optimization of Input: The LLM improves the natural language description before generating the model. We found this approach to be generally not effective and could even be counterproductive. Our findings suggest LLMs may lack the specific domain knowledge needed to reliably improve process descriptions.
- LLM Self-Optimization of Output: The LLM refines the generated model itself. This strategy showed the most promise, particularly for models that initially produced lower-quality outputs. While average improvements were sometimes modest, we observed significant gains in specific instances. However, there was also a risk of quality degradation, emphasizing the need for careful prompt design to avoid unintended changes (hallucinations).
Conclusion:
LLMs hold significant potential for transforming business process modeling, moving it from a traditionally manual and expert-driven task towards a more automated and accessible one. The framework we’ve developed, leveraging prompt engineering, a robust error-handling mechanism, and the sound intermediate representation of POWL, provides a viable pathway for translating natural language process descriptions into executable models in standard notations like BPMN. Our evaluation revealed not only variations in performance across different LLMs, but also consistent patterns. We found a notable correlation between efficient error handling and overall model quality and observed consistent performance trends within similar LLMs. We believe that the ability to translate natural language into accurate and useful process models, including executable BPMN diagrams, could revolutionize business operations.
References:
[1] Kourani, H., van Zelst, S.J. (2023). POWL: Partially Ordered Workflow Language. In: Di Francescomarino, C., Burattin, A., Janiesch, C., Sadiq, S. (eds) Business Process Management. BPM 2023. Lecture Notes in Computer Science, vol 14159. Springer, Cham. https://doi.org/10.1007/978-3-031-41620-0_6.
[2] Kourani, H., Berti, A., Schuster, D., van der Aalst, W.M.P. (2024). Process Modeling with Large Language Models. In: van der Aa, H., Bork, D., Schmidt, R., Sturm, A. (eds) Enterprise, Business-Process and Information Systems Modeling. BPMDS EMMSAD 2024. Lecture Notes in Business Information Processing, vol 511. Springer, Cham. https://doi.org/10.1007/978-3-031-61007-3_18.
[3] Kourani, H., Berti, A., Schuster, D., & van der Aalst, W. M. P. (2024). ProMoAI: Process Modeling with Generative AI. Proceedings of the Thirty-Third International Joint Conference on Artificial Intelligence. https://doi.org/10.24963/ijcai.2024/1014.
[4] Kourani, H., Berti, A., Schuster, D., & van der Aalst, W. M. P. (2024). Evaluating Large Language Models on Business Process Modeling: Framework, Benchmark, and Self-Improvement Analysis. arXiv preprint. https://doi.org/10.48550/arXiv.2412.00023.
Quantum Computing in Process Mining: A New Frontier
This post has been authored by Alessandro Berti.
Introduction
Process mining is a crucial field for understanding and optimizing business processes by extracting knowledge from event logs. Traditional process mining techniques may encounter limitations as data volume and complexity increase. Quantum computing offers a potential solution by tackling these challenges in a fundamentally different way.
What is Quantum Computing?
Quantum computing utilizes quantum mechanics to solve complex problems that are intractable for classical computers. It employs quantum bits, or qubits, which can represent 0, 1, or a combination of both, enabling parallel computations.
How Can Quantum Computing Assist Process Mining?
Quantum computing can potentially revolutionize process mining by:
- Solving Complex Optimization Problems: Process discovery often involves finding the optimal process model that best fits the event log. Quantum algorithms, such as Quadratic Unconstrained Binary Optimization (QUBO), can efficiently solve such optimization problems, leading to more accurate and efficient process discovery.
- Enhancing Anomaly Detection: Quantum kernel methods can map process data into a high-dimensional feature space, enabling better anomaly detection. This can help identify unusual or unexpected behavior in processes, leading to quicker interventions and improvements.
- Improving Process Simulation: Quantum Generative Adversarial Networks (QGANs) can generate synthetic event logs that capture complex correlations in data. This can be used for anonymizing sensitive data, augmenting small datasets, and improving the accuracy of process simulation models.
- Developing Advanced Process Models: Quantum Markov Models can potentially express concurrency and complex rules in a way that is not possible with current models. This can lead to more accurate and realistic representations of business processes.
Challenges and Opportunities
While quantum computing offers significant potential for process mining, it is still in its early stages of development. The current generation of quantum computers, known as Noisy Intermediate-Scale Quantum (NISQ) devices, have limited qubits and are prone to errors. However, advancements in quantum hardware and software are rapidly progressing.
Conclusion
Quantum computing holds immense promise for revolutionizing process mining by enabling faster, more accurate, and more efficient analysis of complex business processes. It allows for a deeper understanding of intricate relationships within process data. As quantum technologies mature, we can expect to see even more innovative applications of quantum computing in process mining, leading to significant improvements in business process management.
Call to Action
We encourage researchers and practitioners in process mining to explore the potential of quantum computing and contribute to the development of new quantum-enhanced process mining techniques.
The Quest For Efficient Stochastic Conformance Checking
This post has been authored by Eduardo Goulart Rocha.
Conformance Checking is a key field of process mining. At its heart, conformance checking deals with two questions:
- How is a process deviating from its ideal flow?
- How severe are these deviations?
To exemplify that, we consider a simplified hiring process inside a company and two event logs depicting its executions in two distinct business units (in the Netherlands and in Germany):


Event logs for a hiring process in a fictitious company’s Dutch (left) and German (right) business units
The log contains a few violations. In this case, some applications are reviewed multiple times, and interviews are sometimes conducted before checking for an applicant’s backgrounds. These can be detected using state of the art conformance checking techniques [1]. A process owner may decide that these violations are acceptable and update the reference model to allow for that, leading to the following model:

Now, both event logs have the same set of variants and both achieve an alignment-based fitness and precision of 1. However, both logs are not the same and we intuitively know which event log is preferred. Repeated CV screenings drain manual resources and should be minimized. Additionally, interviews are more effectively conducted after backgrounds are checked (as more information on the candidate can be collected).
Why Stochastic Conformance Checking
The dilemma above serves as starting point for stochastic conformance checking. While all flows are permitted, some are less desirable. Therefore, we would like to capture what is the preferred behavior of a model and leverage this information when evaluating an event log. In the literature, Stochastic Labeled Petri Nets are used for that. These add weights on top of traditional labeled Petri nets that should be interpreted as “whenever a set of transitions is enabled in a marking, then each enabled transition fires with probability proportional to its weight”. Suppose we assign weights as follows:

This makes it clearer that while repeated reviews are possible, these should be the exception. And that the interview should be preferably conducted after checking for references. This assigns ideal relative frequencies (probabilities) to each trace variant as follows: Now, it is clear that the Dutch business unit is more conforming.
State of the Art in Stochastic Conformance Checking
In its simples form, stochastic conformance checking aims at quantifying deviations considering a process model’s stochastic perspective. An ideal stochastic conformance measure should present three properties:
- It is robust to partial mismatches
- It can be efficiently and exactly computed for a broad class of stochastic languages
- It considers the log and model’s stochastic perspective
In recent years, multiple stochastic conformance measures have been proposed [2-6]. Unfortunately, state of the art measures fall short of one or more of these tasks. The table below summarizes their shortcomings:

Latest Development
In a recent work presented at the ICPM 2024 [7], we made a small step to improve on that. The main idea is to abstract the model and log’s stochastic languages into an N-gram-like model (called its K-th order Markovian abstraction) that represents the relative frequency of each subtrace in the language. In our running example, when k = 2 we obtain:

Model and Logs abstractions: The relative frequency of each subtrace in their respective languages
RA = Review Application, CR = Check References, I = Interview
This abstraction can then be compared using any existing stochastic conformance measure as illustrated in the framework below:
By using the language’s subtraces (instead of full-traces), measures based on this abstraction are naturally more robust to partial mismatches in the data. Furthermore, in REF we also show that this abstraction can be efficiently computed for bounded livelock-free stochastic labeled Petri nets. Last, the model’s abstraction does not depend on sampling and considers the model’s full behavior.
Outlook
While this was some progress, there is still much work to be done in the field. First, the proposed abstraction cannot handle long-term dependencies. Second, we would like to provide diagnostics beyond a single number as feedback to the end-user. Efficient and easy to use conformance methods are imperative for the development of stochastic process mining.
References
- Arya Adriansyah, Boudewijn F. van Dongen, Wil M. P. van der Aalst: Conformance Checking Using Cost-Based Fitness Analysis. EDOC 2011: 55-64
- Sander J. J. Leemans, Wil M. P. van der Aalst, Tobias Brockhoff, Artem Polyvyanyy: Stochastic process mining: Earth movers’ stochastic conformance. Inf. Syst. 102: 101724 (2021)
- Sander J. J. Leemans, Fabrizio Maria Maggi, Marco Montali: Enjoy the silence: Analysis of stochastic Petri nets with silent transitions. Inf. Syst. 124: 102383 (2024)
- Sander J. J. Leemans, Artem Polyvyanyy: Stochastic-Aware Conformance Checking: An Entropy-Based Approach. CAiSE 2020: 217-233
- Artem Polyvyanyy, Alistair Moffat, Luciano García-Bañuelos: An Entropic Relevance Measure for Stochastic Conformance Checking in Process Mining. ICPM 2020: 97-104
- Tian Li, Sander J. J. Leemans, Artem Polyvyanyy: The jensen-shannon distance metric for stochastic conformance checking. ICPM Workshops 2024
- Eduardo Goulart Rocha, Sander J. J. Leemans, Wil M. P. van der Aalst: Stochastic Conformance Checking Based on Expected Subtrace Frequency. ICPM 2024: 73-80
Fast & Sound: Improving the Scalability of Synthesis-Rules-Based Process Discovery
This post has been authored by Tsung-Hao Huang.
Process discovery is a cornerstone of process mining, enabling organizations to uncover the behaviors hidden in their event logs and transform them into actionable process models. While many algorithms exist, few balance between scalability and providing sound, free-choice workflow nets. The Synthesis Miner [1] is one of the algorithms that guarantee these desirable properties while also supporting non-block structures. However, scalability issues have posed challenges for its widespread adoption in real-world applications.

In our recent work [2], we introduced two extensions to address the bottlenecks in the Synthesis Miner’s computation. By leveraging log heuristics and isolating minimal subnets, these extensions reduce the search space and break down generation and evaluation tasks into smaller, more manageable components. The results speak for themselves: our experiments show an average 82.85% reduction in computation time without compromising model quality.

Log heuristics help pinpoint the most likely positions for modifications, reducing the number of nodes and transitions considered for connection. Meanwhile, minimal subnet extraction isolates only the relevant parts of the process model, enabling faster candidate generation and conformance checking. Together, these improvements streamline the process discovery workflow, making it more feasible to apply the Synthesis Miner to larger, real-life event logs.
This work highlights how targeted optimizations can unlock the potential of advanced algorithms in process mining. By addressing scalability challenges, we hope to make tools like the Synthesis Miner more accessible for practical use cases, bridging the gap between process theory and business applications.
[1] Huang, TH., van der Aalst, W.M.P. (2022). Discovering Sound Free-Choice Workflow Nets with Non-block Structures. In: Almeida, J.P.A., Karastoyanova, D., Guizzardi, G., Montali, M., Maggi, F.M., Fonseca, C.M. (eds) Enterprise Design, Operations, and Computing. EDOC 2022. Lecture Notes in Computer Science, vol 13585. Springer, Cham. https://doi.org/10.1007/978-3-031-17604-3_12
[2] Huang, TH., Schneider, E., Pegoraro, M., van der Aalst, W.M.P. (2024). Fast & Sound: Accelerating Synthesis-Rules-Based Process Discovery. In: van der Aa, H., Bork, D., Schmidt, R., Sturm, A. (eds) Enterprise, Business-Process and Information Systems Modeling. BPMDS EMMSAD 2024 2024. Lecture Notes in Business Information Processing, vol 511. Springer, Cham. https://doi.org/10.1007/978-3-031-61007-3_20
