Source: Freepik
Note: The blog post was written by Katharina M. E. Grünwald and therefore has a personal character. She works as a data steward at the RWTH IT Center. Have fun reading!
You are about to start your doctoral thesis, the topic has been decided and you know when everything will start. But suddenly you hear that you also need to have good research data management (RDM) if you want to comply with modern good scientific practice. Your department has special data formats, you have to complete a data management plan (DMP), RWTH Aachen University offers services such as Coscine and the German Research Foundation (DFG) also has guidelines on what it considers to be good RDM. Quite a mess… and now?
Don’t worry – we got you. In this blog post, you will learn in two easy-to-apply steps how to get an overview of the chaos and understand the structure behind it.
It is worth investing time in the RDM at the beginning of your project, as you will benefit from it in the long term: The accuracy of your RDM will facilitate your work and your FAIR published data will be recognized by the research community.
Step 1: The Data Inventory
Inventory: Sit down, take your time and start brainstorming! Write down everything you can think of relating to the broad topic of “data”: this could be common formats in your research, types of devices that generate them, storage locations where you store your data, file sizes, responsibilities and accountabilities for the respective data etc. If you cannot think of anything else, it is also a good idea to ask your colleagues who have been with you for a while and may know data-related things that you were previously unaware of. Keep doing this until you notice that the components mentioned are repeated and it seems as if you have written down the information in full. This completes the inventory.
Data map: Next, you create a mind map from the inventory. From now on, this will be called a “data map” to clearly identify its function. It works like a map to help you find your way around the campus and know where your lab is and where you can find the library. The data map is the digital equivalent of this: it helps you to give shape to the abstract data landscape and to have all the relevant components and storage locations for your project in front of you at a glance. Proceed as follows:
- You or your research group are in the center of the data card. Here it makes sense to consider whether the map should only be useful for you or whether it should also be useful for your group.
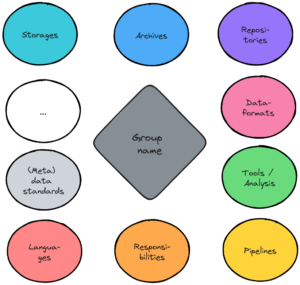
- Around the center are the top categories, in which the contents of the brainstorming session are now sorted and entered. Useful top categories could be
- Storage locations
- Archives
- Repositories for planned data publications
- File formats
- Analysis programs / tools
- Pipelines
- Responsibilities
- (Programming) languages
- Metadata standards
- Connecting lines can be drawn between individual components of the data map to illustrate their relationship.
- My tip: To create the data map digitally, use the open source tool excalidraw.
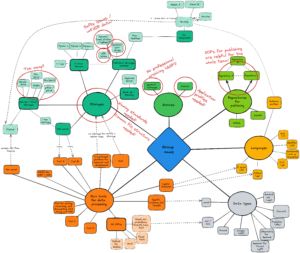
- The two images show a template and an anonymized real data map. You can save the images and drag and drop them onto the blank canvas in Excalidraw to work with them.
- Another benefit of the data map can be that your research group can also easily enter vulnerabilities in the given data infrastructure into it. Maybe you have a security risk or use too many different storage locations, maybe the standardized and therefore FAIR data naming is not yet mandatory. You can mark these weaknesses in red, as in the example of the real data map, and eliminate them over time.
Step 2: The Data Management Plan
You may have already heard of a DMP. A DMP structures the handling of research data in a scientific project and does so in text form. It describes how the data will be managed during and after the project. Decisions on data management are also recorded here with reasons and the DMP should be updated during the course of the project and adapted to the current reality.
Based on your knowledge from the previously created data map, you can easily derive the contents of a DMP. The contents are made up of the requirements of the DFG, your own institution and your own department as well as the data life cycle and document your own planning and decisions.
Many funding bodies, such as the German Research Foundation (DFG), the Austrian Science Fund (FWF), the Swiss National Science Foundation (SNSF), Horizon Europe and the Volkswagen Foundation, expect information on research data management as part of a funding application. If you have already written a DMP, you can easily take text modules from it and put them together modularly for the respective application as expected.
At RWTH Aachen University, the Research Data Management Organizer (RDMO) application is made available to all researchers. When creating the DMP, you will find a number of DMP templates already approved for use from which you can choose. My recommendation is the template “generic: DFG checklist (RWTH template)” published in June 2023. It contains the DFG requirements and is supplemented with the specific RWTH requirements. This relieves you of having to search for all the provisions yourself. However, the template is generic, i.e. the specific requirements of your faculty are not included.
To give you a first impression of the questions to be answered in this template, you will find a brief overview here:
- What types of data are produced?
- Which data and metadata standards are implemented?
- Who has access to the data?
- Under what conditions can the data be reused?
- How can the data be archived?
The two steps – creating the data inventory and then transferring the knowledge into the text form of the DMP – will give you a good overview of the research data situation and infrastructure for your project.
Good luck.
If you have any further questions, please contact the central RDM team at RWTH Aachen University
Responsible for the content of this article is Katharina Grünwald.


Leave a Reply
You must be logged in to post a comment.