

Automatic collection of performance data by monitoring batch jobs on CLAIX: The new infrastructure has been established at the IT Center in the course of the ProPE project. The data allows identifying batch jobs with inefficient performance and hence points to potential optimizations for users.
For CLAIX-2016 and CLAIX-2018 the IT Center is using a continuous performance monitoring on the HPC compute nodes. The new infrastructure lifts the burden of manually employing tools to assess application performance. Therefore, it is getting much easier to analyze and compare batch jobs that have run in the past. At the moment we are also evaluating automatic detection of performance problems in running applications.
Due to privacy concerns, users of the HPC cluster cannot access the performance data right now. However, we are working on a solution so developers can use the measurements to improve their applications. If you are already interested in analyzing the data, please send a message to our ServiceDesk including job ID, host names and time frame.
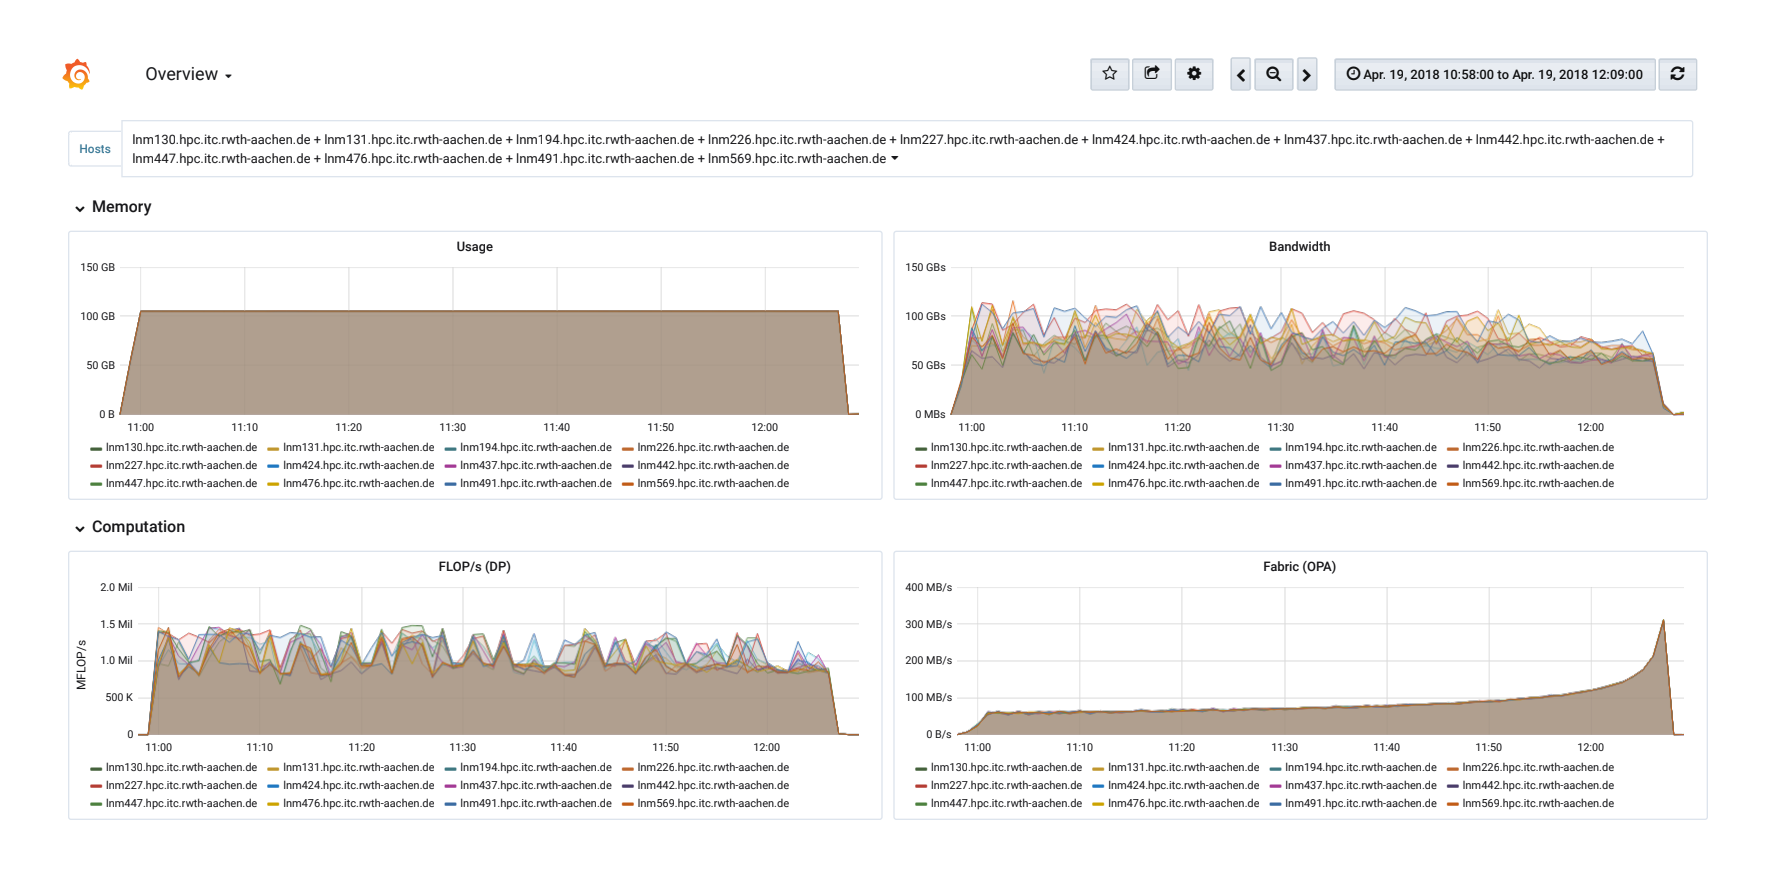
Visualization of performance data in Grafana. The graphs show a run of the High Performance Linpacks (HPL) on 12 MPI nodes (CLAIX-2016). This benchmark is used to determine the ranking in the Top500 list.
Quelle: ProPE
Technical Details
The IT Center uses the Time Series Database (TSDB) InfluxDB to store the measured data. To collect the data each node runs an instance of the monitoring daemon Telegraf. The software has been extended to cover relevant metrics for HPC such as utilization of the OmniPath networks and of the parallel filesystem Lustre. Additionally the daemon uses likwid to read Hardware Performance Counters and get information about the clock frequency, the executed Floating Point Operations per Second (FLOP/s) and the used memory bandwidth.
During realization, it has been paid attention to keep the overhead acceptable that comes from continuous monitoring. That is why the data is queried (only) once per minute which didn’t show significant impact on the tested applications. Hence, this frequency is a tradeoff between the overhead and resulting data volume on the one side and resolution on the other.
There may be side-effects with the continuous monitoring when user-requested performance tools try to use the same hardware registers. To avoid mutual disturbances, users can add parameters to their jobs scripts (please refer to our documentation on IT Center Help, in particular regarding Intel VTune und likwid).
The ProPE project is funded by the German Research Foundation (DFG) for three years (2/2017 – 1/2020). It aims at developing a blueprint for a sustainable, structured, and process-oriented service infrastructure for performance engineering (PE) of high performance applications in German tier-2 or tier-3 scientific computing centers. The project partners are: FAU Erlangen-Nürnberg, TU Dresden, RWTH Aachen.
Verantwortlich für die Inhalte dieses Beitrags sind:
Sandra Wienke/ Jonas Hanfeld: Text & Bild
Sara Kaya: Content Management