

Kategorie: ‘HPCnews’
Infotag 2019: Infostand zu HPC Infrastructure und Virtual Reality Group
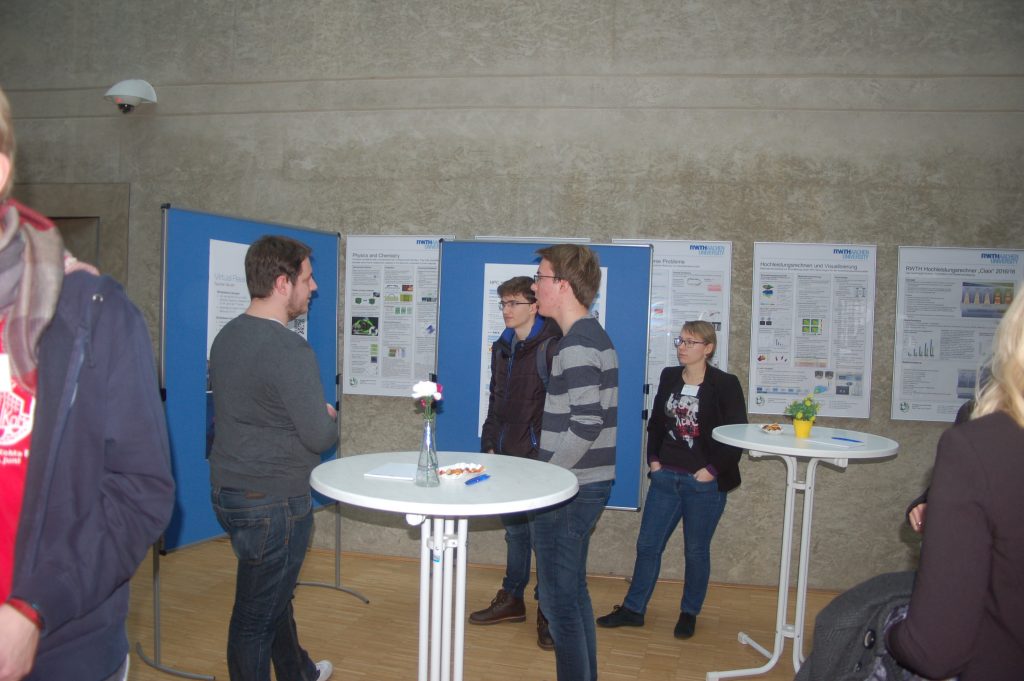
Anlässlich des IT Center-Infotages 2019 fungierte Frau Dr. rer. nat. Sandra Wienke im Rahmen der Posterausstellung, die den zweiten Teil des Programms darstellte, als Expertin zum Thema „HPC Infrastruktur an der RWTH Aachen“, um die Besuchenden zu informieren und ihre aufkommenden Fragen zu beantworten.
Quelle: Eigene Darstellung
Die Interessenten erkundigten sich nach generellen Projekten des IT Centers, insbesondere jedoch nach der allgemeinen Nutzung der HPC-Infrastruktur, wie zum Beispiel dem Login am Hochleistungsrechner oder der zur Verfügung gestellten Rechenzeiten. Im Fokus standen der Einsatz dieser Technik im Bereich der Lehre sowie die verschiedenen Einsatzszenarien, wie beispielsweise in der bei Übungen im Kontext von Lehrveranstaltungen.
Sehr interessiert war ein Besucher an den Möglichkeiten, die HPC-Systeme über das Smartphone anzusteuern. Hierfür gäbe es aktuell jedoch leider noch keine Lösung, so Frau Dr. rer. nat. Wienke. Das Thema werde aber intern evaluiert.
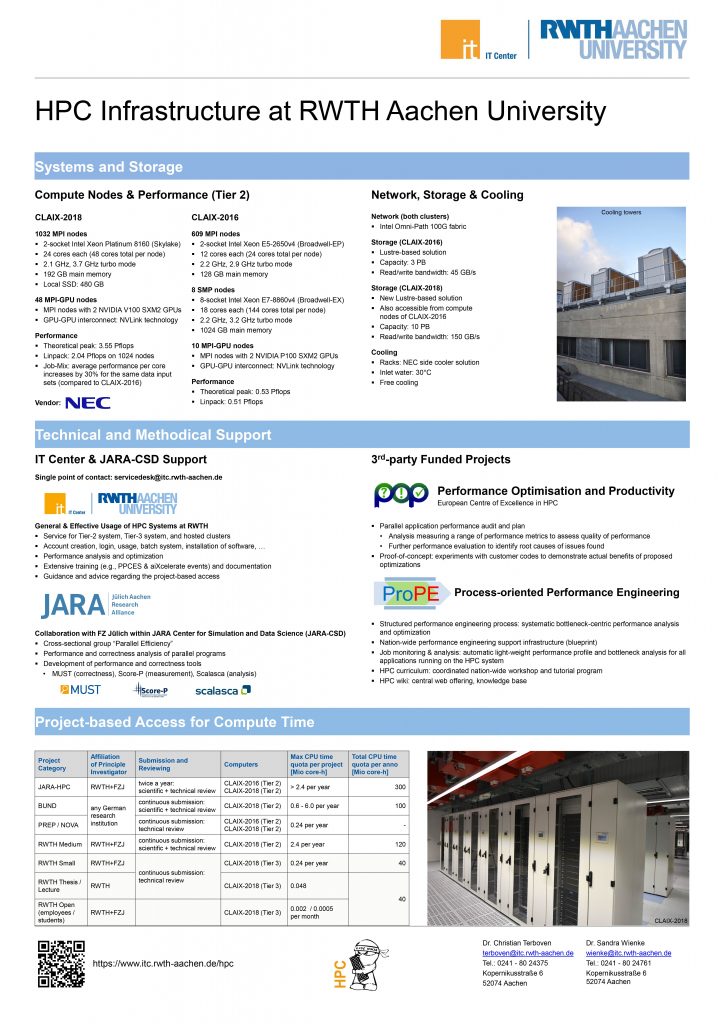
Das in Unterthemen eingeteilte Poster zu der HPC Infrastruktur veranschaulichte die verschiedenen Systeme und Speichermöglichkeiten, die HPC umfasst, aber auch die technische sowie methodische Unterstützung, die die RWTH Aachen in diesem Bereich erfährt.
So widmeten die HPC-Kolleginnen und Kollegen zum Beispiel einen großen Teil der Darstellung der Kooperation zwischen dem IT Center der RWTH und dem Forschungszentrum Jülich, dem European Centre of Excellence in HPC sowie dem DFG- Projekt Process-Oriented Performance Engineering (ProPE).
Quelle: Eigene Darstellung
Ein zweiter, der überaus gutbesuchten Informationsstände, thematisierte die „Virtual Reality Group“. Insgesamt circa 50 Teilnehmende wurden in 4er-Gruppen durch die aixCave des der RWTH Aachen University geführt. Die Besuchenden nahmen die Führung, die sie als sehr spannend empfanden, sehr gut an und zeigten großes Interesse. Die großen Themenbereiche, die auch das Plakat darstellte, waren VR-Hardware-Lösungen, VR-Software-Lösungen sowie die VR-Forschung.
Neben dem generellen Interesse am IT Center, interessierten sich die Besuchenden auch für die Entwicklungen und Perspektiven, die die Virtuelle Realität in Forschung und Lehre bietet. Im direkten Dialog mit IT Center-Mitarbeitenden tauschten sich die Besuchenden auch über ganz spezifische und detaillierte Sachverhalte aus. Konkret wollten Sie wissen, in welchen Forschungsgebieten die aixCave ihren Einsatz findet und, wie diese Forschungsprojekte aussehen. Zur Veranschaulichung wurden den Besuchenden hierzu Beispiele erläutert, die durch Fotos ergänzt wurden.
Das IT Center freute sich sehr über die wissbegierige Besucherschaft, die die Mitarbeitenden der Infostände mit höchst interessanten Fragen konfrontierte und bedankt sich für den aufschlussreichen Austausch.
Quelle: Eigene Darstellung
Nächsten Mittwoch erwartet Sie zur selben Uhrzeit in unserem IT Ceter-Blog ein Beitrag zum Infostand „IT-Services des IT Centers”. Freuen Sie sich auf einen weiteren spannenden Beitrag aus unserer IT Center-Infotag 2019-Serie.
Verantwortlich für die Inhalte des Beitrages sind Sandra Wienke, Andrea Bönsch und Sara Kaya.
Das zentrenunabhängige HPC Wiki im Gauß-Allianz Infobrief
Quelle: Eigene Darstellung
Der Infobrief der Gauß-Allianz berichtet in der April/Mail-Ausgabe 2019 explizit vom HPC Wiki. Doch was macht diese Anwenderdokumentation so besonders?
Beim HPC Wiki handelt es sich um ein Anleitungsportal, das im Rahmen des DFG-Projektes ProPE gewachsen ist und nun auf eigenen Füßen steht. Seit Anfang des Jahres ist das zentrenunbhängige HPC Wiki im Produktivbetrieb und hilft Nutzenden weltweit mit Anleitungen auf englischer Sprache zum Thema High Performance Computing (HPC). Es beinhaltet dabei sowohl die spezifischen Informationen der Rechenezentren (site specifics) als auch generelle Informationen zum High Performance Computing (general information).
CLAIX-2018 – schnellster Hochleistungsrechner an einer deutschen Universität!
Die zweite Ausbaustufe des Clusters Aix-la-Chapelle – kurz CLAIX-2018 – ist abgeschlossen! Damit freuen wir uns auch bekanntzugeben, dass der neue Hochleistungsrechner Anfang Februar 2019 in Betrieb genommen werden kann.
CLAIX-2018 ist der neue Hochleistungsrechner an der RWTH Aachen University, der den Hochleistungsrechenbetrieb um eine außerordentliche Bandbreite an Features ergänzt. Darunter zeichnet er sich vor allem auch in puncto Nachhaltigkeit und Energieeffizienz aus.
Quelle: Eigene Darstellung
Die Server des CLAIX-2018 werden nun mit Wasser gekühlt und das mit Hilfe von Sidecoolern. Auf diese Weise wird eine umweltfreundlichere Kühltechnik ermöglicht, die den Bedarf an Luftkühlung im Serverraum um 90 Prozent reduziert. Auch wird bei der Kühllösung der Systeme auf eine nachhaltigere Variante gesetzt, die eine Wasservorlauftemperatur von bis zu 30 Grad Celsius erlaubt.
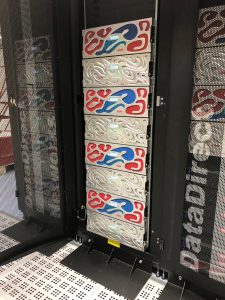
Speicher des Claix-2018.
Quelle: Eigene Darstellung
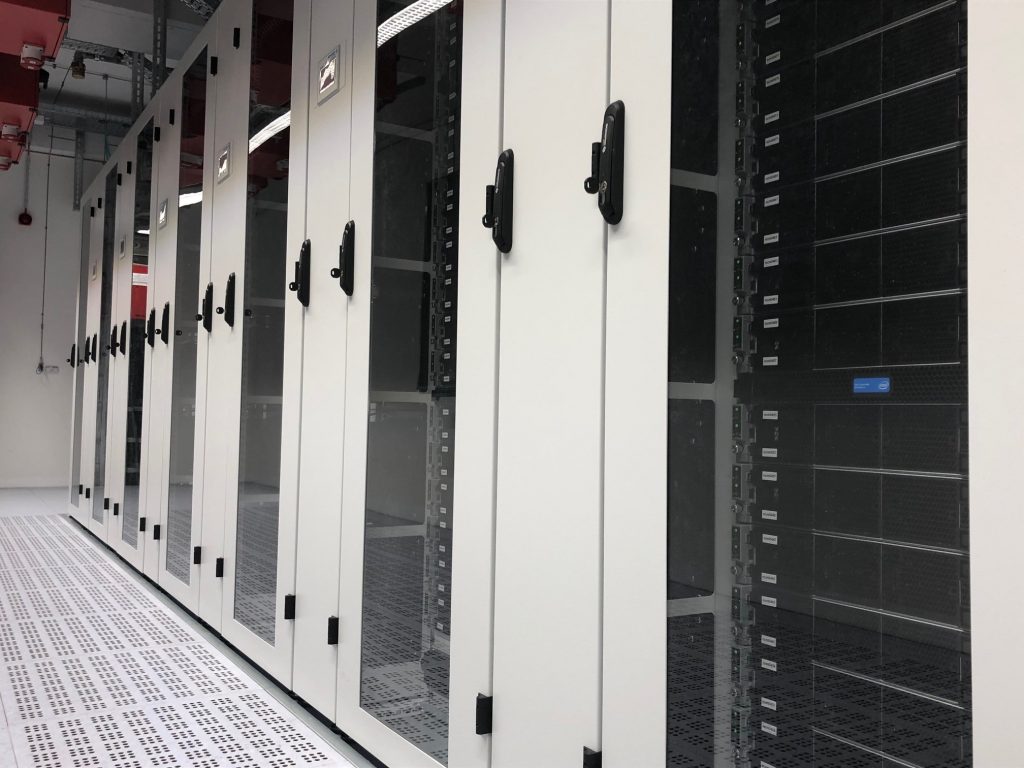
Mit einer umweltfreundlichen Kühltechnik gelingt es, dass der CLAIX-2018 nicht nur unter ökologischen Aspekten eine Innovation darstellt, sondern vor allem auch aus der technischen Perspektive ein echter Superstar unter den Supercomputern ist: Er beheimatet 1.032 MPI-Rechenknoten sowie 48 NVIDIA-GPU-Accelerators, ausgestattet mit jeweils zwei Intel Xeon Platinum 8160-CPUs. Diese Knoten unterstützen die Beschleunigung speziell optimierter Anwendungen und Rechenoperationen. Hochleistung ist hier Name des Programms, durch und durch.
Alle HPC-Systeme von CLAIX-2018 nutzen zusätzlich das HPC interconnect Intel Omni-Path 100G-Netzwerk. Mit CLAIX 2018 wird auch ein komplett neues paralleles HPC-Filesystem auf der Basis des Lustre-Systems in Betrieb genommen. Konkret bedeutet dies, dass eine Kapazität von 10 Petabyte sowie eine Lese- und Schreibbandbreite von 150 Gigabyte pro Sekunde zur Verfügung steht.
Gemessen an den HPC-Ressourcen zählt die RWTH Aachen University somit zu den TOP 10 der deutschen Hochschullandschaft. Wir freuen uns über den Neuzugang in unserem Supercomputer-Kader und blicken mit Freude in die Zukunft.
Wir haben Ihr Interesse geweckt? Dann schauen Sie doch gerne hier weiter!
ProPE Performance Engineering: Überregionaler Support für HPC-Nutzer im Bereich Performance Engineering
—-English version below—-
Quelle: ProPE
Im Rahmen des DFG-Projektes ProPE (Prozessorientiertes Performance-Engineering) gilt es eine Serviceinfrastruktur zu entwickeln, die einen effizienten Gebrauch von Ressourcen im Bereich High Computing standortübergreifend ermöglicht. Dabei stehen die Nutzenden der kooperierenden Rechenzentren, dem ZIH der Technischen Universität Dresden, dem RRZE der Friedrich-Alexander-Universität Erlangen/Nürnberg und dem IT Center der RWTH im Vordergrund, die von den Kompetenzen und Beratungsschwerpunkten aller Kooperationspartner profitieren. Read the rest of this entry »
ProPE Performance Engineering: Eine zentrumsübergreifende HPC-Dokumentation
— English version below —
Quelle: ProPE
In Vorbereitung auf das Nationale Hochleistungsrechnen (NHR) und die Digitale Hochschule NRW (DH-NRW) setzt das IT Center auf eine zentrumsübergreifende HPC-Dokumentation. Im Rahmen des wird die Dokumentation der HPC-Systeme nicht nur vereinheitlicht, sondern direkt zusammengeführt und anschließend sowohl gemeinsam gepflegt, als auch weiterentwickelt. Read the rest of this entry »
ProPE Performance Engineering: Performance Monitoring der HPC-Systeme
Automatic collection of performance data by monitoring batch jobs on CLAIX: The new infrastructure has been established at the IT Center in the course of the ProPE project. The data allows identifying batch jobs with inefficient performance and hence points to potential optimizations for users.
For CLAIX-2016 and CLAIX-2018 the IT Center is using a continuous performance monitoring on the HPC compute nodes. The new infrastructure lifts the burden of manually employing tools to assess application performance. Therefore, it is getting much easier to analyze and compare batch jobs that have run in the past. At the moment we are also evaluating automatic detection of performance problems in running applications.
Due to privacy concerns, users of the HPC cluster cannot access the performance data right now. However, we are working on a solution so developers can use the measurements to improve their applications. If you are already interested in analyzing the data, please send a message to our ServiceDesk including job ID, host names and time frame.
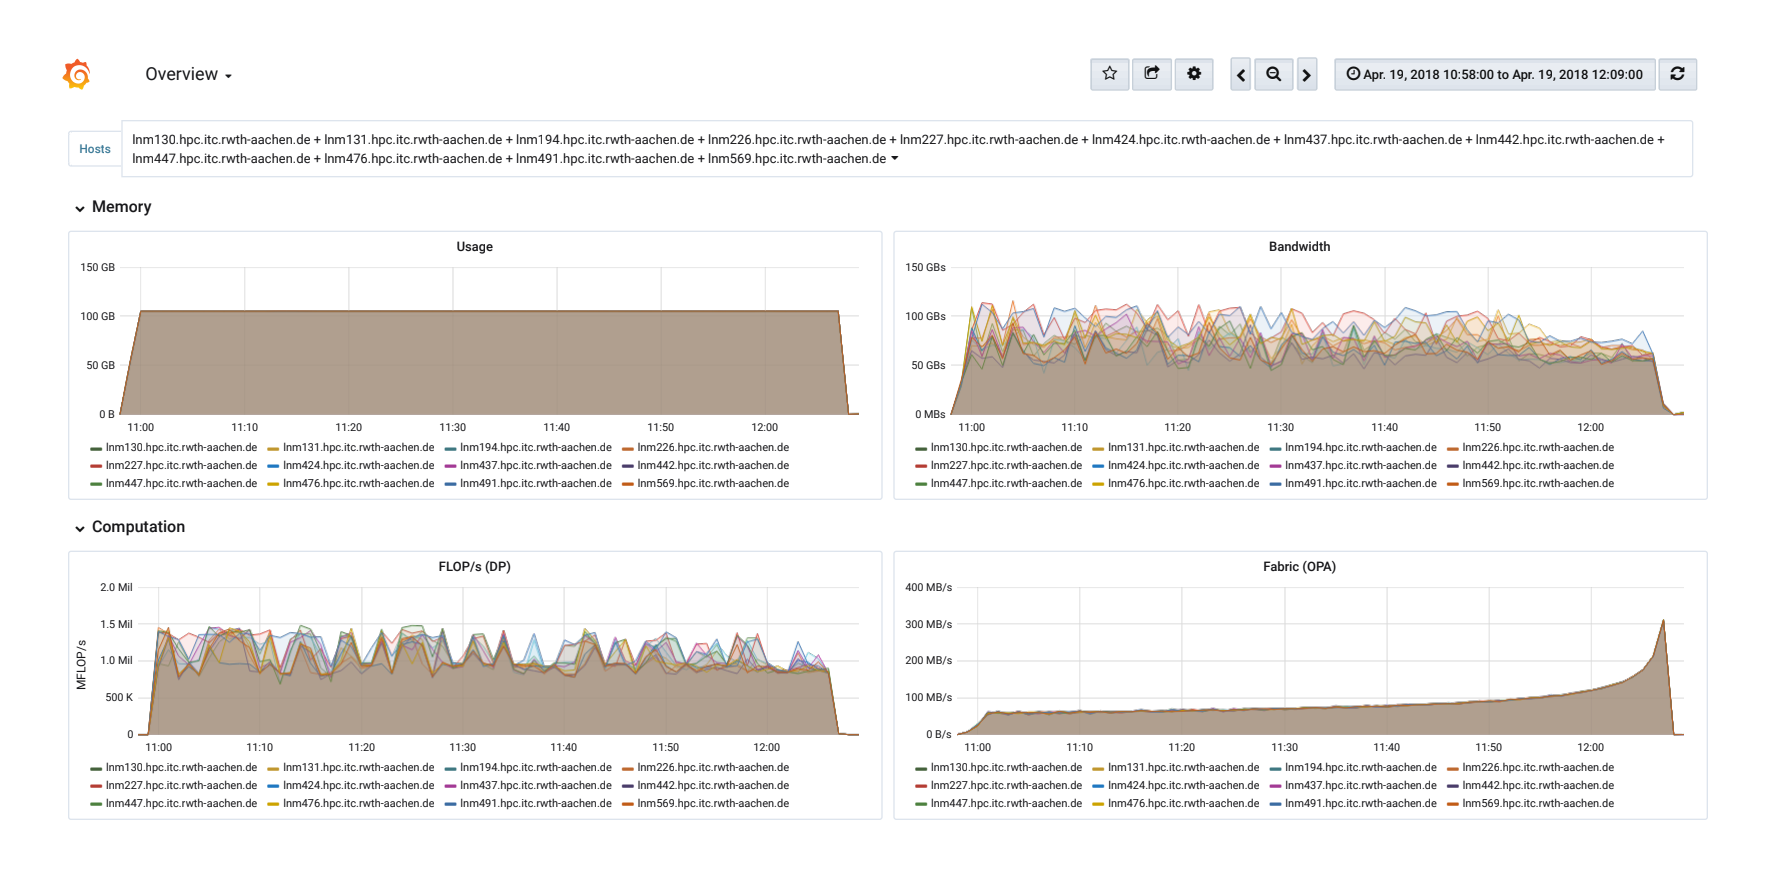
Visualization of performance data in Grafana. The graphs show a run of the High Performance Linpacks (HPL) on 12 MPI nodes (CLAIX-2016). This benchmark is used to determine the ranking in the Top500 list.
Quelle: ProPE
Technical Details
The IT Center uses the Time Series Database (TSDB) InfluxDB to store the measured data. To collect the data each node runs an instance of the monitoring daemon Telegraf. The software has been extended to cover relevant metrics for HPC such as utilization of the OmniPath networks and of the parallel filesystem Lustre. Additionally the daemon uses likwid to read Hardware Performance Counters and get information about the clock frequency, the executed Floating Point Operations per Second (FLOP/s) and the used memory bandwidth.
During realization, it has been paid attention to keep the overhead acceptable that comes from continuous monitoring. That is why the data is queried (only) once per minute which didn’t show significant impact on the tested applications. Hence, this frequency is a tradeoff between the overhead and resulting data volume on the one side and resolution on the other.
There may be side-effects with the continuous monitoring when user-requested performance tools try to use the same hardware registers. To avoid mutual disturbances, users can add parameters to their jobs scripts (please refer to our documentation on IT Center Help, in particular regarding Intel VTune und likwid).
The ProPE project is funded by the German Research Foundation (DFG) for three years (2/2017 – 1/2020). It aims at developing a blueprint for a sustainable, structured, and process-oriented service infrastructure for performance engineering (PE) of high performance applications in German tier-2 or tier-3 scientific computing centers. The project partners are: FAU Erlangen-Nürnberg, TU Dresden, RWTH Aachen.
Verantwortlich für die Inhalte dieses Beitrags sind:
Sandra Wienke/ Jonas Hanfeld: Text & Bild
Sara Kaya: Content Management
HPC Cluster: Wartungen vom 14.05. – 17.05.2018 und vom 23.05. – 26.05.2018

Quelle: Pixabay
In den folgenden Zeiträumen wird der Batchbetrieb des HPC Clusters eingestellt:
14.05., 7:00 Uhr – 17.05.2018, 10:00 Uhr
sowie
23.05., 7:00 Uhr – 26.05.2018, 18:00 Uhr
Grund dafür sind Umbaumaßnahmen an der Stromversorgung. Dabei handelt es sich um notwendige Arbeiten zur Vorbereitung für die Installation des neuen HPC Clusters Claix II.
Diese Schritte zur Vorbereitung der Infrastruktur des neuen Clusters ermöglichen eine Verbesserung der Energieeffizienz und eine Leistungserhöhung. Darüber hinaus werden so die Voraussetzungen für eine verbesserte Zuverlässigkeit und Verfügbarkeit des neuen HPC Clusters geschaffen.
Systemwartung des RWTH Compute Clusters

Quelle: Pixabay
Auch der RWTH Compute Cluster muss gewartet werden, daher wird am kommenden Mittwoch eine große Systemwartung durchgeführt. Diese ist von 08:00 – 14:00 Uhr angesetzt und beinhaltet Wartungsarbeiten an den Netzwerk-Switchen, ein Versionsupgrade der Lustre-Server (HPCWORK) und der LSF-Software (Diese Software ist für Abarbeitung der Batch-Jobs verantwortlich).
Während des Wartungsfensters können Sie sich auf den Frontends einloggen und auch auf die Verzeichnisse $HOME und $WORK zugreifen. Das Verzeichnis „$HPCWORK“ steht während der Wartung nicht zur Verfügung. Zudem wird es während der Wartung nicht möglich sein, Jobs abzuschicken.
Weitere Informationen erhalten Sie auf unserer Störungsmeldungsseite.
Wir danken Ihnen für Ihr Verständnis.
Einladung zur Informationsveranstaltung: Abschaltung des Windows HPC-Batchbetriebs
Quelle: Eigene Darstellung
Nach 10 Jahren Hochleistungsrechnen auf dem Betriebssystem Windows wird der Batchbetrieb des Windows HPC-Clusters des IT Centers zum Jahresende (31.12.2015) eingestellt. Diese Maßnahme ist aufgrund der aktuellen Entwicklungen und aus betrieblichen Gründen notwendig.
Der Betrieb der Frontends des Windows-HPC-Clusters ist hiervon vorerst nicht betroffen.
Das Team der High Performance Computing Gruppe lädt daher herzlich am Mittwoch, den 28. Oktober 2015 zu einer Informationsveranstaltung ein, bei der Sie einen Überblick und Antworten auf folgende Fragen erhalten:
- Wieso ist die Abschaltung des WinHPC Batchbetriebs notwendig geworden?
- Wie sehen Nutzungsalternativen aus?
- Und wie geht es mit dem Frontend Betrieb weiter?
Aber auch für weitere Fragen und die Darstellung Ihrer Anforderungen an ein Batchbetrieb bleibt genügend Raum.
Interesse? Dann registrieren Sie sich auf der entsprechenden Webseite für die Teilnahme an der Veranstaltung.
Hier geht es lang.